Executive Insights

How Do Your Operational, Supply Chain & RCM Strategies Compare?

Insights From the 2025 L.E.K. Health System Executive Survey
December 3, 2025

Key takeaways

Most respondents to L.E.K. Consulting’s 2025 Health System Executive Survey shared three key priorities: increasing operational and cost efficiency, enhancing supply chain and purchasing, and improving revenue capture/revenue cycle management. 

In supply chain, leaders are focused on cost and resiliency, while in revenue cycle management, they are implementing continuous improvement plans emphasizing process discipline, AI and automation, and clinical documentation training.

Eight in 10 hospitals are proactively reviewing costs against their long-term revenue outlook, considering levers related to staffing, facility consolidation and service line portfolio rationalization.  

In this piece, we offer a series of questions to help you assess your organization’s progress on these priorities and identify where you may be missing opportunities. 

In L.E.K. Consulting’s previous article  in the 2025 Health System Executive Survey series, we highlighted the divide in the financial health of U.S. hospitals and health systems, with roughly half of executives reporting that their organization’s position is constrained. Across both financially constrained and stable systems, however, most leaders pointed to three key priorities: increasing operational and cost efficiency, enhancing supply chain and purchasing, and improving revenue capture and revenue cycle management (RCM). For systems under pressure, these moves are critical to stabilize performance, while for stronger systems they are equally important in order to protect margin, create capacity and maintain a competitive edge.

This edition of L.E.K.’s Executive Insights examines:

  • What hospital and health system leaders are doing to reduce costs and increase operational efficiency
  • What supply chain and purchasing priorities hospital leaders are elevating — and the immediate cost-cut actions to take
  • The continuous improvement playbook hospitals are deploying for RCM
  • Pharmacy operations as a case study in advancing all three priorities

Increasing operational and cost efficiency

Increasing operational and cost efficiency is the No. 1 strategic priority cited in this year’s survey — and today’s operating environment leaves little room for reactive cost measures. In fact, 8 in 10 hospitals and health systems report proactively reviewing costs against their long-term revenue outlook as opposed to reactive reductions (see Figure 1).

Figure 1

Current approach to cost structure optimization (2025)

Image
Current approach to cost structure optimization (2025)

Figure 1

Current approach to cost structure optimization (2025)

Image
Current approach to cost structure optimization (2025)

Leaders are most commonly prioritizing staffing-, facility footprint- and service line-related levers to optimize their cost structure (see Figure 2):

  • Staffing: Reducing reliance on travel nurses, ensuring top-of-license practice and revisiting compensation for physicians/staff are among the top levers. Leaders should also ensure they are leveraging advanced practice providers efficiently, optimizing call coverage and assessing areas of overstaffing/underutilization.
  • Facility consolidation: Co-locating or exiting underutilized sites to concentrate volume.
  • Service-line portfolio rationalization: Trimming or repositioning low-margin services and/or non-core services. In our experience, this lever should be considered only after the prior two.

Figure 2

Top actions hospitals/health systems are currently taking or planning to take to optimize cost structure

Image
Top actions hospitals/health systems are currently taking or planning to take to optimize cost structure

Figure 2

Top actions hospitals/health systems are currently taking or planning to take to optimize cost structure

Image
Top actions hospitals/health systems are currently taking or planning to take to optimize cost structure

Leaders should also look at their general and administrative (G&A) spend, one of the most overlooked areas of opportunity. Organizations should be reviewing service contracts, bidding them competitively and evaluating outsourcing decisions for non-core functions.

From our vantage point, top-performing healthcare organizations are focusing intensely on cost now, across profit and loss, to ensure sustainable operations for the future.

Enhancing supply chain and purchasing

Leaders are applying the same discipline to supply chain, where resiliency and cost reduction are top priorities (see Figure 3).

Figure 3

Top hospital/health system supply chain priorities

Image
Top hospital/health system supply chain priorities

Figure 3

Top hospital/health system supply chain priorities

Image
Top hospital/health system supply chain priorities

Leaders should consider the following actions to reduce supply chain costs:

  • Consolidate redundant vendors
  • Standardize contracts systemwide for scale discounts
  • Run competitive requests for proposal (RFPs) and renegotiate service contracts using market benchmarks
  • Reduce unnecessary utilization
  • Tighten value analysis governance
  • Leverage group purchasing organizations (GPOs) and distributors more thoughtfully where it improves price and term

To improve resiliency, leaders should consider dual-sourcing critical stock-keeping units (SKUs), preapproving substitutes and setting forward-buy triggers for tariff or shortage risk.

Data and analytics are key enablers of these priorities. Supply chain leaders should integrate clinical and financial data so the item master, preference cards, spend analytics and case costing can be analyzed together. They should also consider using forecasting and procurement automation to help prevent stockouts and reduce cost variability. True insight into holistic cost of care is the vanguard for effectively managing cost structure, taking risk and evolving the supply chain operation into a competitive advantage — and an emerging generation of analytical tools can help systems achieve this.

Improving revenue capture/RCM

Nearly 60% of executives report an increase in cost to collect over the past three years — and roughly 80% of hospitals report having a continuous improvement plan for RCM. Some see an accelerating “arms race” between payers and providers as artificial intelligence (AI) functionality embeds within RCM processes. For most organizations, now is the time for a sharp look at status quo approaches to avoid being left behind.

The common elements of the improvement agenda in our 2025 survey — and where we see outsized impact — include (see Figure 4):

  • Process discipline to prevent underpayment and denials (e.g., order-to-bill integrity, time-based care coding, medical necessity checks, clean claim rates, denial prevention at the source)
  • AI and automation (e.g., scribing, coding, adjudication, eligibility checks, prior authorizations) to remove manual rework and errors
  • Regular audits and clinical documentation training to ensure coding reflects acuity and services rendered — especially as service settings and workflows diversify

Figure 4

Top actions hospitals/health systems are currently taking to improve revenue capture/RCM

Image
Top actions hospitals/health systems are currently taking to improve revenue capture/RCM

Figure 4

Top actions hospitals/health systems are currently taking to improve revenue capture/RCM

Image
Top actions hospitals/health systems are currently taking to improve revenue capture/RCM

Where do you stack up?

The following questions can help assess your organization’s operational, cost, supply chain and RCM efficiency

Operational and cost efficiency

  • Do we have a plan to reduce premium labor (e.g., accelerated hiring, internal float pool, flexible scheduling)?
  • Are clinicians consistently working at the top of their license?
  • Does our compensation align with fair market value, and have incentives aligned with performance?
  • Have we optimized our on-call coverage plan?
  • Are we optimizing facility utilization before adding new capacity?
  • Have we completed a facility and service-line review with clear keep/turnaround/exit decisions?
  • Have we reviewed G&A spend, including whether to insource or outsource non-core functions (e.g., human resources, marketing, information technology, pharmacy support) and whether service contracts are competitively bid?
     

Supply chain and purchasing

  • Have we consolidated vendors and standardized contracts where outcomes are equivalent?
  • Are we running competitive RFPs and using GPO/distributor leverage when it helps?
  • Do we have active value analysis that reduces SKU variation and connects choices to case-cost visibility?
  • Have we mapped tariff/exposure risk and put basic inventory controls in place (e.g., weekly cycle counts, enforced reorder points) before layering advanced tools?
  • Do we regularly review all overhead expenses, including leasing, equipment and support services?
  • Are we accelerating biosimilar adoption and standardizing formularies to reduce drug costs (and where we have leverage, preserving buy-and-bill economics by limiting white bagging)?

Revenue capture and RCM

  • Do we have a 95% first-pass clean claims rate?
  • Are we reducing the amount of time it takes to get paid?
  • Do our highest revenue units have the documentation support needed to code and bill correctly?
  • Do we have a systematic approach to root-cause analysis and prevention of recurring denials?
  • Have we automated the routine work and introduced AI where possible?
  • Are eligible prescriptions consistently captured through 340B channels while staying compliant?

If you answered “no” to any of these questions, your organization may be leaving substantial value on the table.

Conclusion

No hospital is immune to operational and financial pressure in 2025. Our survey shows leaders converging on the same agenda: efficiency to protect revenue integrity and reduce cost per case. The organizations that execute this agenda with discipline and data are more likely to outperform, regardless of macro volatility.

L.E.K. will publish additional insights from its 2025 Health System Executive Survey in the coming months, providing more detail as to the actions health systems are taking in each of these priority areas. Please register here and select HEALTHCARE SERVICES for these and other future updates.

To discuss how L.E.K. helps health systems determine and execute their strategic priorities, please contact us.

Note: AI was used in the drafting of this article.

L.E.K. Consulting is a registered trademark of L.E.K. Consulting LLC. All other products and brands mentioned in this document are properties of their respective owners. © 2025 L.E.K. Consulting LLC 

English

Beyond Clinical: Where the Real Growth in Skincare Lies

December 2, 2025

This webinar presents new findings from L.E.K.’s survey of more than 3,500 consumers in the US, UK and France. It defines the key behavioral segments in skincare and links them to measurable value outcomes such as spend, loyalty and lifetime value.

In the discussion, L.E.K. Partners Philippe Gorge, Maria Steingoltz and Mark Boyd-Boland outline where growth is concentrated and how brands and investors can capture it.

Watch the recording now. 

L.E.K. Consulting is a registered trademark of L.E.K. Consulting LLC. All other products and brands mentioned in this document are properties of their respective owners. © 2025 L.E.K. Consulting LLC

English
Executive Insights

Distributor Partnerships in SEA: Unlocking Market Potential for MNC Companies in Healthcare

December 2, 2025

Key takeaways

SEA’s medtech growth collides with fragmented regulation, decentralized procurement, and complex logistics—making distributor partnerships a critical, lower-risk route to market access and scale.  

Distributor selection matters: match regional vs. national coverage and full-service vs. core distribution to portfolio needs; prioritize regulatory reach, tender access, last-mile reliability, and financial strength.  

Partnership model choice (3PL/logistics-only, non-exclusive, exclusive, regional agreements, hybrid, JV) should align with desired control, internal capabilities, product complexity, and country-specific hurdles.  

Execution is decisive: set governance and KPIs, monitor inventory and coordination, and adapt the model (e.g., in-house for tier-1 cities plus local partners elsewhere) to sustain performance and mitigate risk. 

The Southeast Asia (SEA) medtech market is growing rapidly, driven by an expanding middle class, aging populations, and increasing healthcare investments. Despite these promising macro trends, MNCs face persistent challenges including fragmented regulations, complex procurement mechanisms, and heterogenous market opportunity across the region.

In this context, distributor partnerships have emerged as critical enablers of market access and sustainable growth, offering an effective alternative to direct market entry by companies. Distributors offer MNCs local regulatory knowledge, access to fragmented markets, and the flexibility to tailor commercial models to specific market conditions. These partnerships extend across the value chain, spanning importation, logistics, registration and commercialization support, allowing medtechs to scale effectively while managing risk.

In this paper, LEK Consulting aims to provide a structured view of distributor partnerships in SEA, examining the drivers, trade-offs of different partnership models, and key questions/considerations to inform a resilient and scalable commercialization strategy mediated by distributor partnerships.

Section 1: Drivers of distributor partnerships in SEA

The diverse nature of SEA markets requires a flexible and customized approach to market entry and expansion. Local distributors, with their in-depth market knowledge and networks, play a crucial role in this strategy. Key factors driving the increasing reliance on distributor partnerships include:

Figure 1

Parameters for “Why” or “Why not” choosing distributors partners (focused markets)

Image
Parameters for “Why” or “Why not” choosing distributors partners (focused markets)

Figure 1

Parameters for “Why” or “Why not” choosing distributors partners (focused markets)

Image
Parameters for “Why” or “Why not” choosing distributors partners (focused markets)

While understanding market dynamics is crucial, MedTech MNCs must also evaluate internal factors to make informed decisions about partnering with distributors. These company-specific considerations ensure that the chosen partnership model aligns with the organization’s capabilities, resources, and strategic objectives. Below are the additional key factors to consider:

  1. Strategic Alignment
    Evaluate whether distributor partnerships support long-term strategic objectives such as market penetration, brand positioning, and growth targets.
  2. Internal capabilities and resources
    Assess whether your company has the resources and expertise to manage distribution independently. If lacking distribution capabilities but possessing a robust in-house sales team, consider leveraging third-party logistics (3PL) for logistical support rather than pursuing complex partnerships.
  3. Cashflow considerations
    Consider the potential impact of delayed payments from hospital accounts on cash flow. Distributor partnerships can provide financial stability by mitigating the risks associated with delayed payments, especially in markets with insufficient public financing.
  4. Portfolio priorities
    Limited in-market experience and a focus on specific product segments drive the need for distributor partnerships. High-volume, repetitive-use products that do not require strong clinical engagement are particularly well-suited for local distribution.

With varying regulations, healthcare spending, economic conditions, and customer preferences, SEA demands flexible, market-specific strategies. Local distributors support this need with deep market insights and established networks.

Key factors driving increasing need for distributor partnerships include:

  1. Protectionist regulatory environment 
    Many SEA countries maintain protectionist policies, requiring MNCs to work with local agents or legal entities for market entry, particularly in government procurement processes.

Figure 2

Image
Figure 2

Figure 2

Image
Figure 2
  1. Decentralized procurement processes 
    Most SEA countries, except Singapore, Procurement is often fragmented, requiring local agents to access tenders. In countries, like Thailand and Philippines, local agents adeptly handle the administrative requirements of government tenders
  2. Complex logistics
    Geographical challenges (e.g., Indonesia, Philippines, Vietnam) and inadequate transport infrastructure make it costly for companies to build in-house distribution capabilities beyond major cities particularly ensuring reliable last mile deliveries in remote areas
  3. Account fragmentation
    The market landscape in SEA involves navigating both public and private healthcare systems, each with distinct procurement procedures and regulatory requirements. Tailored strategies are necessary to effectively serve
    each segment.
  4. Cultural sensitivity and language requirements
    Local agents/distributors are increasingly playing a role to ensure cultural nuances are considered to enable better communication with healthcare providers and regulators, improving marketing efforts in the local context. For example, in Vietnam, regulatory documents must be submitted in Vietnamese, and face-to-face interactions with hospital administrators and Ministry of Health officials are often expected as part of relationship-building

Section 2: Types of partnership models and decision framework

The choice of partnership model hinges on several factors, including the degree of ownership of commercial rights, internal capabilities, product portfolio complexity, and local market intricacies. Common models include:

Figure 3

Image
Common types of MedTech partnership models with distributors

Figure 3

Image
Common types of MedTech partnership models with distributors
  1. Logistics only partnerships
    Medtechs with an established brand and local presence (e.g., HQ or marketing office) often retain commercial control while outsourcing only logistics to 3PL providers. Companies like Medtronic, GE Healthcare, Shimadzu, and Siemens Healthineers manage sales and marketing directly from regional hubs in Singapore, while appointing 3PLs for warehousing and transport
  2. Non-exclusive distributor partnerships
    Multiple distributors are appointed in the same market to ensure supply continuity, coverage breadth, and risk mitigation—especially in markets with fragmented healthcare systems or procurement channels. Principals tend to engage 1-3 local distributors for the same portfolio, as each has their strengths in different regions and local relationship is often required to secure tenders
  3. Exclusive distributor partnerships
    These are single partner models where commercial rights are granted to the local distributor for marketing and distribute on of agreed upon MNC product portfolio. Local distributors may further engage sub-distributors (with services limited to sales and invoicing) to achieve deeper penetration in provincial tenders and better local navigation. For example, in the Philippines, RBGM Medical acts as an exclusive partner for brands like Medtronic and Zeiss enabling deep market coverage across both public and private sectors via its 4PL capabilities
  4. Regionalized distribution agreements
    Medtechs often engage regional distributors to handle commoditized or well-established product lines across multiple countries, optimizing scale and consistency in execution. With strong financials to hold inventory and nationwide logistic infrastructure, regional distributors are often engaged by
    principals for mature and established brand portfolio that require less marketing (e.g., J&J sutures, Roche diagnostics) for 4PL services For example, IDS Med partners with Bioptimal to distribute critical care consumables across Singapore, Malaysia, Thailand, Vietnam, and the Philippines—leveraging Bioptimal’s regional infrastructure and hospital network
  5. Hybrid strategic partnerships
    In SEA, medtechs often use hybrid distribution models—managing tier 1 cities in-house while outsourcing to local partners elsewhere. This allows them to retain control over key accounts and clinical engagement in major urban centers. In countries like Vietnam, local distributors are essential for navigating provincial tenders and extending reach beyond Hanoi and Ho Chi Minh City
  6. Joint venture
    medtechs may establish JVs with local market access players to accelerate penetration, often combining regulatory, manufacturing, and commercial capabilities. For example, Shockwave Medical entered a JV with Genesis medtech in China to localize registration, manufacturing, and commercialization of its Intravascular Lithotripsy platform—gaining faster market entry and supply-chain integration 

Each model brings trade-offs between control, cost-efficiency, and speed-to-market. medtechs must evaluate local market size, regulatory hurdles, competition intensity, distributor capabilities, and their own strategic priorities to deter mine the most suitable structure.

Image
Figure 4
Image
Figure 4

The choice of partnership model is closely tied to the capabilities and characteristics of the distributors. In SEA, the diversity of markets—ranging from developed economies with established healthcare infrastructure to emerging markets with unique logistical challenges—necessitates careful consideration of the types of distributors engaged.

Distributors in SEA can be classified by two key dimensions: geographic coverage (global, regional, national, or sub-national) and service breadth (ranging from core distribution to full-service offerings including regulatory, logistics, marketing, and after-sales support).

  • Regional full-service distributors operate across multiple SEA markets, integrating regulatory, commercial, and operational support. They are essential partners for scaling across the region. For instance, IDS Med offers end-to-end services in SEA, supporting OEMs with compliance, technical services, and customer engagement
  • Regional core distribution distributors focus on logistics and supply across multiple markets but offer limited support in regulatory or marketing functions. MedAid exemplifies this model, ensuring product availability in SEA and Hong Kong while relying on OEMs for customer-facing activities
  • National full-service distributors serve as strategic local partners, especially for high-touch products needing deep market access. Medi-Life in Malaysia, for example, builds strong relationships with key accounts, enhancing competitiveness in public tenders
  • National core distribution distributors provide efficient, cost-effective logistics within a single market, typically for low-touch products. Enseval Medika Prima (EMP) in Indonesia distributes medical consumables nationwide, ensuring broad access even in remote areas through a strong logistics network

Leveraging this multi-perspective decision-making framework ensures a comprehensive and informed approach to determining the type of partnership and selecting the right distributor for MedTech companies in SEA.

Figure 5

Assessment framework on type of partnership to pursue

Image
Assessment framework on type of partnership to pursue

Figure 5

Assessment framework on type of partnership to pursue

Image
Assessment framework on type of partnership to pursue

Figure 6

Distributor selection criteria

Image
Distributor selection criteria

Figure 6

Distributor selection criteria

Image
Distributor selection criteria

Section 3: Key Lessons for Successful Execution

The challenges faced by the MNC in its partnership with the distributor highlight key vulnerabilities that can arise when critical operational aspects like inventory management, market coordination, and accountability are not closely monitored. This example illustrates the importance of ongoing oversight and adaptability in maintaining successful distributor relationships, especially in a competitive market like MedTech. Drawing from these lessons, we can see how strategic management of partnerships is essential for MedTech companies operating in SEA.

Case Study: A MedTech Partnership Gone Wrong

In the competitive MedTech industry, partnerships with distributors are critical to market success. This case study examines how a global medical device company (MNC)
encountered major issues in its partnership with a large distributor, which also operated as an original equipment manufacturer (OEM) in the endoscopy space.

Figure

Image
Case Study: A MedTech Partnership Gone Wrong

Figure

Image
Case Study: A MedTech Partnership Gone Wrong

Case Study: Distribution model revision for a global medical device company in the disposable syringes space in Indonesia

In a highly competitive and logistically complex market such as Indonesia, the strategic distribution planning, deliberate partner selection, and the design of an effective distribution model is critical for effective market penetration.

Figure

Image
Case Study: Distribution model revision for a global medical device company in the disposable syringes space in Indonesia

Figure

Image
Case Study: Distribution model revision for a global medical device company in the disposable syringes space in Indonesia

Closing thoughts

SEA offers vast potential for medtech growth, but its fragmented markets and complex regulations demand flexible, locally attuned strategies. Distributor partnerships are central to this effort, providing the reach, expertise, and agility that multinational companies need to succeed.

Building resilient distribution models require careful due diligence, strategic alignment, and ongoing performance oversight. The rise of hybrid approaches, regionalized agreements, and full-service partnerships underscores the importance of flexibility and local adaptation. By carefully selecting and managing these partnerships, MNCs can navigate the complexities of SEA markets and achieve sustainable growth.

Additional reference:

  1. Unlocking Future Growth: APAC Medtech Outlook 2025
  2. Southeast Asia Hospital Insights Survey (2025)
  3. Fueling the APAC Medtech Innovation Engine: An Ecosystem Investment

L.E.K. Consulting is a registered trademark of L.E.K. Consulting LLC. All other products and brands mentioned in this document are properties of their respective owners. © 2025 L.E.K. Consulting LLC

English
Executive Insights

Opportunities for Rare Diseases to Drive Growth in Big Pharma

December 1, 2025

Key takeaways

The non-oncology orphan market represents the largest specialty-care growth engine outside of oncology, forecast to exceed $300 billion globally by 2030 and growing at approximately 9%.

Importantly, while orphan drug revenues are lower than those of non-orphan products, the average of the top 50 orphan drugs still achieves blockbuster status, and investment in the pipeline is poised to drive future growth by targeting chronic orphan diseases with meaningful patient populations.

The opportunity to deploy capital efficiently has driven growth and is expected to continue, though it is not universal across assets; many (but not all) indications feature faster and smaller trials, smaller commercial footprint, etc. 

Achieving success will require flawless biopharma execution, from early patient-finding and robust HEOR generation to clear articulation of residual unmet need and strong delivery of meaningful patient benefits. 

Rare disease is not rare. Over 30 million Americans, or approximately 10% of the country, are affected by diseases with patient populations less than 200,000, according to the U.S. Food and Drug Administration (FDA). These diseases number over 7,000, many are life-threatening and the majority have no approved treatment.

The Orphan Drug Act of 1983 established incentives that transformed rare diseases from neglected conditions into a strategic growth area for the industry. In 2024, 26 of CDER’s 50 novel approvals (52%) carried orphan designations (oncology and non-oncology). Non-oncology orphan drugs are projected to contribute nearly one-third of global prescription sales by 2030 at $324 billion, outpacing the growth of the broader pharma market (see Figure 1) and totaling revenues on par with the gross domestic product of countries such as Finland, Chile and Portugal.

Figure 1

Non-oncology orphan drug market growth and average and median revenues

Image
Non-oncology orphan drug market growth and average and median revenues

Figure 1

Non-oncology orphan drug market growth and average and median revenues

Image
Non-oncology orphan drug market growth and average and median revenues

Importantly, non-oncology orphan indications have become of strategic importance to large-cap biopharma, with revenues projected to reach over $100B in sales by 2030F across the top 15 pharma (over 13% of their total 2030F sales) and signaling increasing relevance to their long-term growth.

Advantages in orphan markets

Participation in orphan disease markets may offer biopharma companies uniquely advantaged models for value creation given their potential for relative capital efficiency (see Figure 2). The key drivers underpinning this potential for a favorable risk-reward profile include:

  • Clinical development efficiency
    Clinical programs are typically lean, with pivotal trials often enrolling about 60% fewer patients in Phase III trials vs. non-orphan drugs, reducing both cost and time-to-market and improving ROI.
  • Higher probability of success
    Orphan assets demonstrate meaningfully higher development success rates, with an overall likelihood of approval from Phase I of roughly 30% compared to approximately 20% for non-orphan programs. This is because they frequently target well-validated biology, yield larger effect sizes in enriched populations, benefit from regulatory flexibility and are conducted at concentrated centers of excellence with engaged patient networks.
  • Regulatory advantages
    Specialized FDA guidance (e.g., on trial design and endpoints) and flexibility (e.g., acceptance of surrogate endpoints and single-arm or adaptive clinical designs) can streamline the regulatory process and are complemented by incentives such as priority review vouchers.
  • Policy environment
    The One Big Beautiful Bill Act has expanded the Inflation Reduction Act’s orphan drug exemption, allowing multi-indication rare disease products to remain insulated from Medicare price negotiations. The negotiation eligibility for orphan drugs that later gain non-rare disease indications now begins at the non-orphan approval date, thereby delaying exposure.
  • Competitive insulation
    First-in-class therapies typically retain a strong leadership position, often maintaining greater than a 60% share five years post-launch. Across launched non-oncology drugs, rare disease indications average around four marketed therapies per disease, compared to approximately nine for non-rare indications.
  • Commercial infrastructure
    Orphan patient populations are often concentrated within a limited number of centers of excellence, enabling high-touch patient services and smaller field teams.

Figure 2

Benefits of being an orphan asset (excluding oncology)

Image
Benefits of being an orphan asset (excluding oncology)

Figure 2

Benefits of being an orphan asset (excluding oncology)

Image
Benefits of being an orphan asset (excluding oncology)

Despite these potential advantages, it is important to note that these are not universal and do not guarantee success. While there can be multiple advantages in pursuing rare diseases, these can attenuate in indications lacking natural histories or validated endpoints, or where effective SoCs force active comparator trials. Participation in orphan disease does not guarantee success. Indeed, success can breed competition and erode expected advantages.

Proven success stories and drivers

While historically viewed as niche, some orphan drugs have demonstrated blockbuster, and even mega-blockbuster, success. Advances in precision biology, life cycle expansion and patient access have enabled several therapies to achieve multibillion-dollar revenues, reshaping expectations for the commercial scale of rare disease products. While the largest non-orphan blockbusters boast larger top lines than the largest orphan assets, the average of the top 50 orphan products still reaches $1.7 billion. Some analyses suggest that on a per-indication comparison, orphan assets are on par with those of non-orphan assets. As of 2024, one orphan therapy surpassed $10 billion, another delivered $5 billion and 18 others have achieved more than $1 billion in annual sales.

These blockbuster orphan drugs tend to share a common set of attributes that have enabled their success (Figure 3 shows four examples), via:

  • Redefining standards of care by delivering transformative efficacy and safety. For example, Trikafta, Vertex’s therapy for cystic fibrosis (CF), revolutionized treatment by delivering substantially improved FEV, exacerbations and QoL over prior doublets, enabling greater treatment duration and use. Trikafta also showed benefit across a wider range of genotypes and age groups, expanding the addressable population to cover most CF patients.
  • Applying disciplined life cycle expansion to broaden reach over time. For example, Alexion expanded Soliris and Ultomiris applicability both across rare indications (PNH, aHUS, gMG and NMOSD) and within indications (e.g., expanded eligibility and dosing advantages for higher uptake).
  • Providing convenient administration accelerates uptake and adherence. For example, Hemlibra replaced frequent IV infusions with subcutaneous prophylaxis while enhancing bleed control in both inhibitor and non-inhibitor patients.
  • Finally, enabling robust patient identification and activation amplifies market impact: Vyndaqel, Amvuttra and Attruby are unlocking a largely undiagnosed transthyretin amyloidosis population through investment in genetic testing, diagnostic programs and advocacy engagements.

Given the association of many orphan success stories, these attributes could provide the foundation for the next wave of orphan innovation.

Figure 3

Example leading rare disease franchises and key products

Image
Example leading rare disease franchises and key products

Figure 3

Example leading rare disease franchises and key products

Image
Example leading rare disease franchises and key products

Future opportunities

Orphan investment has exploded over the past approximately 10 years and is primed for continued growth. There are currently about 1,500 drugs in development for rare diseases worldwide, up from just about 800 in 2015. Dozens of orphan therapies are expected to reach the market in the next five years.

Applying learnings from prior success to a simple scan of the orphan pipeline helps develop hypotheses on potential future meaningful opportunities. These include indications such as IgA nephropathy, Von Willebrand disease, primary biliary cholangitis and Charcot-Marie-Tooth disease, among others (see Figure 4). 

Each of these areas exhibits similar hallmarks that enabled prior orphan blockbusters: high unmet need resulting in the potential for transformative efficacy and safety, strong patient activation potential and scalable infrastructure. While the quality of the assets has not been evaluated as part of this assessment, the breadth of the pipeline and characteristics of the indications being pursued suggest that the orphan space is poised for continued growth.

Figure 4

Examples of future orphan drug opportunities

Image
Examples of future orphan drug opportunities

Figure 4

Examples of future orphan drug opportunities

Image
Examples of future orphan drug opportunities

Realizing the potential in these emerging indications will require the following:

  • Deliver transformative efficacy
    Build unequivocal evidence of a step-change in efficacy across endpoints routinely accepted as establishing durable benefit in as wide a patient population as possible.
  • Clearly define epidemiology
    Reliable prevalence data is critical and companies that invest early in clarifying disease epidemiology create the foundation for both payer negotiations and patient advocacy engagement.
  • Systematically find patients
    Successful companies are deploying multi-pronged approaches to resolve diagnostics bottlenecks, including genetic testing, AI-driven EMR mining and specialist education to uncover untreated and undertreated populations.
  • Articulate residual unmet need
    Even in conditions with existing therapies, residual gaps (durability, administration burden, partial efficacy) must be clearly documented (e.g., patient-reported outcomes are particularly powerful in demonstrating quality-of-life improvements).
  • Build a robust HEOR evidence base
    As orphan drugs expand toward meaningful patient populations, payers are likely to demand evidence of reduced or eliminated downstream costs, exacerbating the need to quantify avoided hospitalizations, productivity loss and long-term complications.
  • Engage stakeholders early
    Proactive dialogue with regulators, payers and advocacy groups, including co-developing trial endpoints with regulators and collaborating on diagnostic infrastructure, can potentially accelerate adoption and support favorable coverage.

Together, these imperatives can define a repeatable model to successfully capture the opportunity in orphan drugs.

Overall outlook

The orphan drug segment is likely to remain one of the most attractive growth areas in pharma. Potential for structural advantages, resilient demand and emerging indications point toward further expansion. While policy scrutiny is likely to continue, orphan assets remain comparatively advantaged and continue to attract both investor and strategic interest.

For pharma leaders, the opportunity lies not only in scientific innovation but also in systematic market development, from patient-finding to downstream value demonstration. Companies that integrate these elements are likely to be best positioned to capture the next wave of growth in orphan drugs.

For more information, please contact us.

References

2024 FDA New Drug Therapy Approvals Annual Report
https://www.fda.gov/media/184967/download 

FDA Orphan Drug Act
https://www.fda.gov/industry/medical-products-rare-diseases-and-conditions/designating-orphan-product-drugs-and-biological-products

EMA Market exclusivity orphan medicines
https://www.ema.europa.eu/en/human-regulatory-overview/post-authorisation/orphan-designation-post-authorisation/market-exclusivity-orphan-medicines

Medicare Drug Price Negotiation Program guidance
https://www.cms.gov/files/document/revised-medicare-drug-price-negotiation-program-guidance-june-2023.pdf

MIT Project ALPHA
https://projectalpha.mit.edu/pos/

Wong et al., JAMA Network Open (2023)
https://jamanetwork.com/journals/jamanetworkopen/fullarticle/2808944

Booth, Bruce. “Twenty Years in Early-Stage Biotech VC, Part 1.” LifeSciVC, 10 Oct. 2025
https://lifescivc.com/2025/10/twenty-years-in-early-stage-biotech-vc-part-1/

JAMA orphan drug vs non-orphan drug revenues (asset level)
https://jamanetwork.com/journals/jama/fullarticle/2804613%20

IQVA white paper (source for lack of generic competition and SOC claims)
https://www.iqvia.com/-/media/iqvia/pdfs/library/white-papers/from-orphan-to-opportunity-mastering-rare-disease-launch-excellence.pdf

L.E.K. Consulting is a registered trademark of L.E.K. Consulting LLC. All other products and brands mentioned in this document are properties of their respective owners. © 2025 L.E.K. Consulting LLC

English

Unlocking Growth and Efficiency Through Supply Chain Simplification

December 1, 2025

Complexity has emerged as a key issue in recent years as leading consumer packaged goods portfolios have grown in complexity with innovation, brand partnerships and pressure to grow in the face of market headwinds. Supply chain complexity is any characteristic of a business that adds cost, whether directly or indirectly. This complexity can be generated by the product portfolio, the end-to-end (E2E) supply chain and business processes.

Identifying and addressing these drivers of complexity can enable businesses to enhance performance, achieve transformative outcomes and effectively target growth opportunities. To successfully navigate and reduce complexity, organizations must adopt a structured approach to diagnosing and managing these drivers (see Figure 1).

Image
Figure 1 F&B complexity broadly comes from the product portfolio, the supply chain designed to make products and the business processes used to effectively manage them
Image
Figure 1 F&B complexity broadly comes from the product portfolio, the supply chain designed to make products and the business processes used to effectively manage them

Breaking down ‘good’ vs. ‘bad’ complexity

Not all supply chain complexity is inherently bad complexity. Certain business models rely on being a “complexity sponge” that can effectively manage high levels of complexity. For example, contract manufacturers and packaging manufacturers (e.g., film, labels) are successful because they manage highly complex processes on behalf of their clients. In many cases, complexity also creates value by driving growth through innovation, line extensions and differentiated product offerings.

Conversely, bad complexity negatively impacts performance by introducing inefficiencies and added costs across the product portfolio, E2E supply chain and business processes. Clearly distinguishing between good and bad complexity is essential for strategic prioritization (see Figure 2).

Image
Figure 2 Poor performance is often the first symptom of unmanaged complexity
Image
Figure 2 Poor performance is often the first symptom of unmanaged complexity

Commercial attractiveness in food and beverage (F&B) — when is complexity good for your business?

Complexity is good for a business when it drives financial, commercial or strategic value. There are three primary drivers to look at when assessing value: value to the customer, differentiated value for end consumers and positive financial or strategic impact for the business. This “trifecta” value can be isolated through quantitative metrics such as base turns and all-commodity volume distribution and through qualitative measures such as customer feedback and consumer sentiment.

Bad complexity adds cost and operational challenges without creating value for the business — this should be systematically identified and rationalized. Good complexity should be retained, and simplification efforts should evaluate root causes of complexity and remediate where possible to lower complexity while retaining value (see Figure 3).

Image
Figure 3 Implementing a structured model to root out bad complexity and properly manage good complexity is essential to value creation
Image
Figure 3 Implementing a structured model to root out bad complexity and properly manage good complexity is essential to value creation

What value does simplification drive?

Simplification drives operational performance improvement, transformational outcomes and growth enablement for F&B manufacturers:

Simplification as a performance improvement and cost unlock

Proper complexity management can unlock value by improving E2E performance:

  • By optimizing the portfolio and product changeovers, a manufacturer identified a 60 basis point margin uplift, primarily through labor and waste reduction.
  • An F&B manufacturer realized 25% savings by bringing case packing in-house, reducing interplant movements and reliance on contract manufacturers.
  • Simplification efforts enabled a manufacturer to target high-overuse product lines and stock-keeping units (SKUs), creating opportunities to improve gross margin by 500+ basis points.

Simplification driving transformational outcomes

The identification and management of bad complexity enables businesses to prioritize investments that drive transformational outcomes:

  • Portfolio simplification freed up capacity at a manufacturer and allowed them to internalize a previously contract-manufactured product, lowering external costs while improving agility and control.
  • A simplified product portfolio helped an F&B manufacturer strategize allergen labeling and align the offering to optimize allergen management in production.
  • Following simplification, a food business unit was able to reallocate resources to accelerate digital transformation initiatives, transitioning from firefighting to leading the company through the digital change curve.

Simplification enables growth

Capacity and resource constraints often prevent businesses from pursuing new product innovation and other critical growth opportunities. This challenge is magnified in complex product portfolios where resources are diverted to support poorly performing SKUs. By eliminating bad complexity, businesses can focus on new growth opportunities through innovation and new product offerings:

  • An F&B manufacturer eliminated underperforming seasonal SKUs to focus on fewer, high-performing SKUs in high seasons and new offerings in underpenetrated seasons, enabling a key retailer to change its end-cap configuration and increase sales.
  • Simplification enabled a manufacturer to combine three product lines into one new line that resonated more strongly with consumers.
  • Capacity that increased through simplification enabled an F&B manufacturer to launch new variety packs that met consumer demand and opened access to additional retail channels.

How L.E.K. Consulting’s simplification capabilities help clients create value

We take a collaborative and data-driven approach to identifying and addressing unmanaged complexity. We work closely with clients to baseline the E2E supply chain and establish commercial context, enabling us to quantify the quantitative and qualitative drivers of complexity for each business unit.

Using a tailored complexity composite scoring framework, we diagnose complexity and integrate findings with consumer and customer insights through a trifecta assessment (see Figure 4). This process categorizes SKUs based on good and bad complexity.

Image
Figure 4 Our approach to identifying, valuing and solving for unmanaged complexity
Image
Figure 4 Our approach to identifying, valuing and solving for unmanaged complexity

Based on this analysis, we deliver a prioritized set of simplification opportunities, supported by roadmaps for resourcing and execution. Each solution is tailored to the client’s unique challenges to ensure lasting impact and sustainable outcomes.

Supply chain simplification can improve efficiency, strengthen performance and accelerate growth. Contact us to learn more.

L.E.K. Consulting is a registered trademark of L.E.K. Consulting LLC. All other products and brands mentioned in this document are properties of their respective owners. © 2025 L.E.K. Consulting LLC

English

Why Investors Need Integrated Commercial and Technology Due Diligence

November 25, 2025

One of the most commonly overlooked risks in today’s deals is failing to connect commercial ambition with the technology required to deliver it.

Investors may see a target with strong demand signals, loyal customers and a growth plan that appears solid in the deal book. But if the underlying systems can’t back up that plan, if the technology can’t scale to meet demand or if data and security gaps undermine execution, that upside quickly erodes. Too often, commercial due diligence (CDD) and technology due diligence (TDD) are treated as separate workstreams, leaving investors with blind spots that surface only after close.

At L.E.K. Consulting, we integrate CDD and TDD from the start, giving investors a single, evidence-backed view of both opportunity and risk — and the confidence to move forward.

Five reasons to integrate CDD and TDD

  1. Tie growth ambition to technology reality

    Every deal starts with a growth story. CDD validates a market’s attractiveness, customer demand and expansion opportunities, but that upside is only real if the technology can support it.

    Integrated due diligence ensures growth plans are anchored in technical feasibility. Can the platform scale horizontally to add users and vertically to handle greater throughput? Is the data architecture ready for analytics and artificial intelligence (AI)? Does the engineering team have the capacity to deliver on the roadmap?

    By testing these questions, investors avoid paying for growth that looks convincing in the confidential information memorandum but cannot be achieved in practice.
  2. Spot risks early — and identify overlooked strengths

    CDD alone may reveal customer frustrations with reliability, but without a technical review, the root causes — brittle code, legacy systems or technical debt — remain hidden until after close.

    Integration also surfaces upside. Modern data infrastructure, mature DevOps practices or proprietary algorithms can create durable pricing power and open new revenue streams. Cybersecurity is another critical factor: Weaknesses in protocols or compliance can trigger costly breaches that undo the commercial thesis.

    With both lenses applied, investors see risks in time to mitigate them and strengths they can build into the investment case.
  3. Ground the valuation model in technical reality

    Deal models are only as strong as the assumptions beneath them. Revenue forecasts tied to fragile systems or immature data capabilities collapse under scrutiny.

    Integrated due diligence stress-tests projections against scalability limits, ties capex to modernization needs and links working capital to actual delivery timelines. Just as important, it separates AI upside that is enabled by data maturity from claims that are aspirational only.

    The result is a valuation model that reflects the company’s true capacity to perform — one that investors can defend in competitive processes.
     
  4. Enter Day 1 with clarity on execution

    Deals often lose momentum when strategy and delivery are not aligned. Integrated CDD and TDD sharpen priorities before close: Technology upgrades can be sequenced with commercial initiatives, AI analytics can reinforce customer strategies, and security improvements can remove barriers to growth.

    This approach converts due diligence findings into a practical roadmap for the first 100 days and beyond, giving investors and management teams the confidence to move decisively.
  5. Gain an edge in competitive deal environments

    Running a stand-alone TDD has become a baseline expectation. The real advantage lies in showing how technology findings strengthen or constrain the commercial story.

    Integration shortens timelines, reduces duplication and streamlines management sessions. It also provides stronger negotiating leverage. Investors can adjust price, structure escrows or frame earnouts with evidence rather than estimates.

    In crowded auctions, that clarity can be the difference between winning a deal at the right valuation or walking away.

Our integrated approach to CDD and TDD

What sets our due diligence apart is not just depth but integration. Our model brings commercial and technology teams together from the start so findings reinforce each other instead of sitting in silos. CDD looks at where the growth is and what customers value most, while TDD tests whether the systems, data and teams can deliver at scale. Together, they give investors a complete view of both opportunity and constraint.

Depending on the deal, our work may take different forms — a rightsized technology diagnostic of the stack and team, a codebase deep dive that pinpoints quality and security, or value creation planning that maps IT investments to growth and AI enablement. In every case, technical findings are tied directly back to the commercial thesis so due diligence translates into action. This connection is grounded in a structured framework that looks at seven dimensions of technology maturity, each reframed as an investor question:

  1. Can the architecture scale with growth?
  2. Is the data fit for analytics and AI?
  3. Will the codebase enable rapid iteration or slow it down?
  4. Where is technical debt creating drag?
  5. Is security resilient under scrutiny?
  6. Does the team have the capacity and skills to deliver?
  7. Is the roadmap aligned with the investment thesis?

These dimensions provide the framework, but their value is clearest in transactions where both lenses matter. A healthcare information technology provider preparing for a sale, for example, relied on our integrated CDD and TDD to prove that its platform could both perform today and scale tomorrow — a narrative that ultimately strengthened investor confidence.

Why integration wins

For investors, separating CDD and TDD leaves blind spots that weaken conviction. Integration provides a single, coherent view of upside and risk — linking growth ambition to the technology required to deliver it.

The outputs are designed to be concise and investor-ready, from scorecards and maturity models to focused assessments of product management and engineering. By tying every technical finding back to the commercial thesis, integration ensures that due diligence translates into a roadmap investors can act on.

In today’s environment, where speed, certainty and differentiation matter, that clarity can decide who wins the deal. To see how integrated due diligence can strengthen your investment decisions, contact us.

L.E.K. Consulting is a registered trademark of L.E.K. Consulting LLC. All other products and brands mentioned in this document are properties of their respective owners. © 2025 L.E.K. Consulting LLC

English

Indonesia’s Clinical Trial Ecosystem: From Potential to Performance

November 25, 2025

Southeast Asia (SEA) represents one of the world’s most underutilized regions for clinical research. Despite comprising nearly 8% of the global population and disease burden, it contributes less than 2% of total clinical trials — a striking imbalance that underscores both the unmet medical need and the untapped market potential. For global sponsors and Contract Research Organizations (CROs) seeking cost-effective, diverse patient access, this gap represents a compelling growth opportunity.

Within this landscape, Indonesia stands out as the region’s largest and most underleveraged player. Home to more than 275 million people — over 40% of SEA’s population — the country offers unparalleled scale for patient recruitment and disease diversity. Yet, for decades, its participation in global clinical trials has remained low, constrained by regulatory fragmentation, inconsistent quality standards and limited trial infrastructure. These barriers have historically disincentivized multinational engagement and kept Indonesia on the periphery of global R&D ecosystems.

This dynamic is changing rapidly. Through decisive structural reforms, the Indonesian Ministry of Health has taken bold steps to reposition the country as a credible and competitive destination for clinical research. Central to this transformation is the establishment of the Indonesian Clinical Research Consortium (INA-CRC), a new national body tasked with centralizing oversight, streamlining regulatory approvals and standardizing processes across institutions. These reforms are fostering a more transparent, efficient and predictable environment — one that reduces start-up times, enhances data reliability and aligns local practices with international standards.

As a result, Indonesia’s clinical trial landscape is entering an inflection point. The market is expected to expand significantly, with local trial volumes projected to triple to around 300 studies and reach a value of $1 billion to $1.5 billion in the medium term. Beyond the numbers, the broader opportunity lies in Indonesia’s evolution into a regional hub — anchored by its demographic scale, cost competitiveness and growing institutional capability.

For biopharma sponsors and CROs, now is the time to engage. With reform momentum building and investor confidence rising, Indonesia offers a rare first-mover advantage in a market poised for structural takeoff — transforming from an overlooked segment into a cornerstone of SEA’s clinical research future.

For further insights into our analysis, download the full presentation.

Contact us for more information. 

L.E.K. Consulting is a registered trademark of L.E.K. Consulting LLC. All other products and brands mentioned in this document are properties of their respective owners. © 2025 L.E.K. Consulting LLC

English

Employability in Focus: Dubai's Higher Education Advantage

November 18, 2025

Cedwyn Fernandes
Cedwyn Fernandes

As Dubai cements its position as a global education hub, employability has emerged as one of the most critical value propositions for universities operating in the region.

In this video, Professor Cedwyn Fernandes of Middlesex University Dubai shares how employability sits at the very core of the University’s mission — and how that approach has evolved in parallel with Dubai’s rapidly maturing economy.

L.E.K. Consulting is a registered trademark of L.E.K. Consulting LLC. All other products and brands mentioned in this document are properties of their respective owners. © 2025 L.E.K. Consulting LLC

English
Image
Process Industry Automation in 2025 report cover
Special Report

Process Industry Automation in 2025

November 18, 2025

Process industry automation is entering a new phase of growth as AI and advanced control systems transform industrial operations. This joint analysis by L.E.K. Consulting and Harris Williams builds on an earlier report and examines the factors driving expansion, the emerging technologies changing performance expectations, and the implications for investors and operators. 

Download the full report to find out more.

English

Implementing Dynamic Pricing in B2B Outsourced Services

November 17, 2025

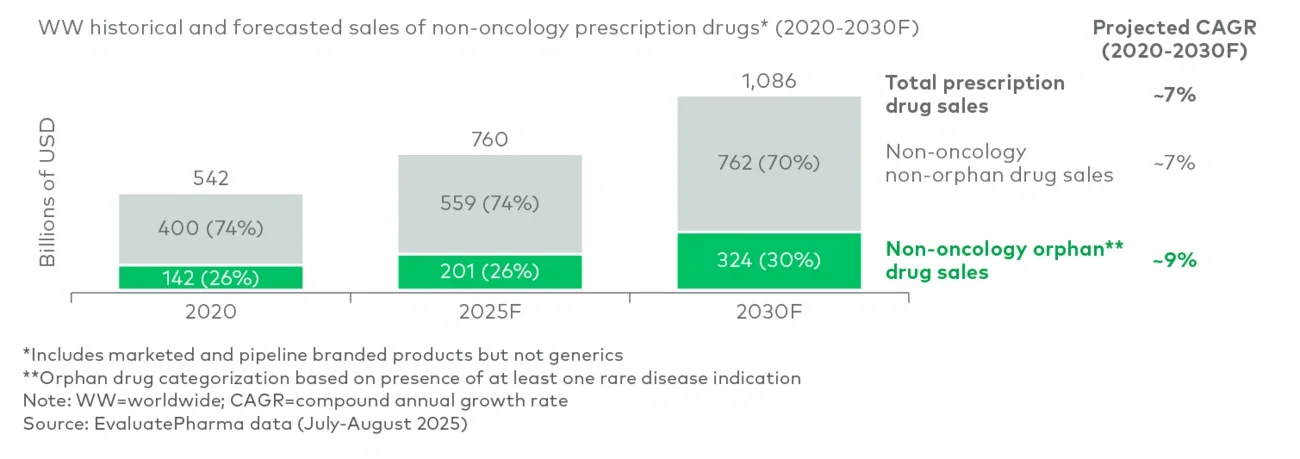
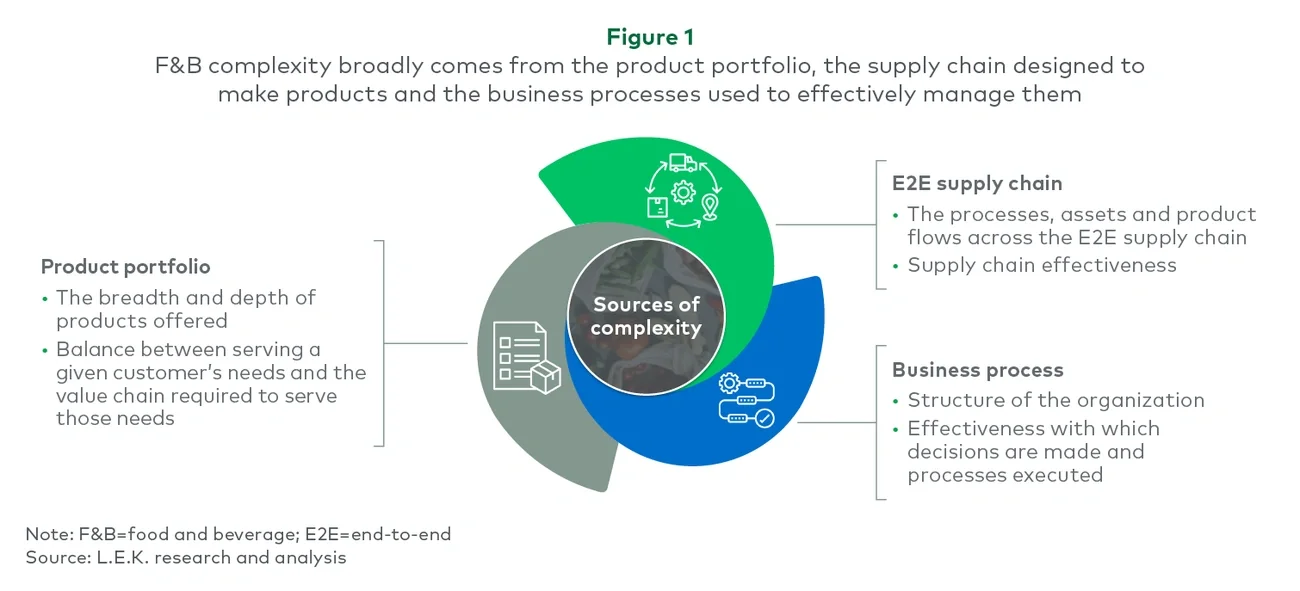
From contract research organisations (CROs) in life sciences to IT managed services firms and logistics providers, B2B outsourced service providers all face a similar challenge: they serve diverse customers with different needs and willingness to pay. 

A biotech start-up seeking affordable preclinical testing has very different price expectations from a global pharmaceutical company outsourcing integrated discovery programs. Similarly, in IT managed services, a small regional business looking for basic support has very different requirements from a multinational outsourcing its global infrastructure. 

This heterogeneity makes pricing one of the most critical, and most underutilised, levers in outsourced services.

Service providers also have to deal with volatile levels of utilisation and therefore bottlenecks across service lines or geographies, which directly and significantly impact their unit economics, their investment decisions and overall bottom line. Being able to charge a premium when capacity is scarce, or discount to increase utilisation, can materially benefit financial performance.

The prevalence of cost-plus pricing

Today, most outsourced service providers rely on cost-plus pricing, adding a standard margin to the direct cost of service delivery. This approach is straightforward, transparent and often welcomed by procurement functions of customers, as it reduces disputes over fairness and ensures cost recovery. 

From an operational standpoint, it provides clarity to account teams, streamlines the quotation process and reduces internal debate. But cost-plus also leaves significant value on the table. It ignores differences in customer willingness to pay, fails to reflect the strategic value or level of differentiation of certain services, and does not typically reflect capacity utilisation considerations.

Adopting alternative approaches to improve yield

Several other pricing models are available. Value-based pricing seeks to set prices in line with the economic value delivered to customers and can significantly enhance revenue capture, especially when the service is clearly linked to outcomes or customer ROI. A more dynamic, capacity-based model can also drive utilisation by flexing prices depending on demand levels and resource availability.

At the same time, competitive pricing realities cannot be ignored. In many outsourced industries, services are only partially differentiated and customers view alternatives as interchangeable. Competitor price corridors often limit pricing freedom, unless the provider has distinctive technology, proprietary data or a brand that customers are willing to pay a premium for.

Principles for a modern pricing framework for outsourced services

To move beyond cost-plus, providers should embed clear principles into a modern pricing framework that can be applied consistently across service lines and customer types. These principles should underpin how price levels are defined, how discounts are managed and how guardrails are enforced:

  • Anchor prices on customer value
    Pricing must reflect customer willingness to pay, and the strategic importance and value of a project, recognising that different customers value the same service differently.
  • Reflect project delivery requirements
    Complexity, delivery risk and resource intensity should shape price levels, ensuring effort and risk are adequately compensated.
  • Align pricing with capacity utilisation
    When capacity is scarce, prices should maximise yield; when capacity is underutilised, winning new business becomes the priority.
  • Ensure customer alignment and defensibility
    Pricing must be explainable in negotiations and defensible if challenged, balancing fairness with value capture.
  • Design for usability and adoption
    A framework is only effective if commercial teams can apply it consistently; principles must translate into clear, practical tools and rules.

A well-designed pricing framework should create the foundation for profitable, yet fair and defensible, pricing that the sales team can effectively and consistently apply.

Adopting dynamic pricing in B2B outsourced services

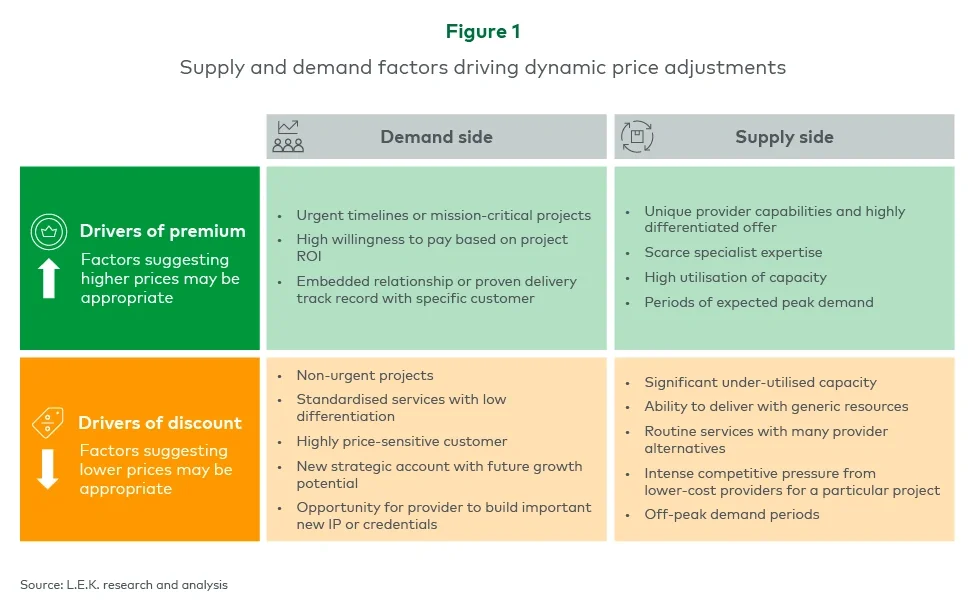
Dynamic pricing has significant potential in outsourced services, but in a B2B context it must be carefully deployed to protect — and ideally strengthen — customer relationships. In certain markets (e.g. air travel, hotels or certain e-commerce platforms), customers are used to significant price volatility and will tolerate frequent and often inexplicable changes in prices. 

B2B customers value predictability and trust. Dynamic pricing should not involve constant price fluctuations. Instead, it could be structured as discounts off a high initial price point (‘list price’), occasionally through the addition of straightforward, acceptable surcharges to reflect specific, transparent factors (e.g. project urgency).

The exhibit below illustrates how supply and demand factors can be codified to guide structured, defensible dynamic pricing decisions (see Figure 1).

Image
Figure 1. Supply and demand factors driving dynamic price adjustments
Image
Figure 1. Supply and demand factors driving dynamic price adjustments

This structured approach ensures that dynamic pricing maximises profitability and utilisation while remaining transparent, consistent and acceptable by customers.  

Organisational capabilities matter as much as the pricing model

Even the best-designed pricing model will fail without end-to-end organisational capabilities to manage it. Providers must embed these into their commercial organisation and processes:

  • Customer segmentation
    Grouping customers by industry, size, behaviour and willingness-to-pay to enable differentiated strategies
  • Offer design and packaging
    Structuring services and bundles in a way that highlights value and supports tiered pricing
  • Pricing governance
    Establishing policies, approval processes, and guardrails that ensure consistency and accountability
  • Pricing analytics and insights
    Building capability to analyse value, simulate scenarios and generate actionable recommendations
  • Quotation and bid management
    Implementing structured, consistent processes for developing proposals and avoiding leakage
  • Contract and revenue management
    Monitoring terms and conditions, enforcing compliance, and preventing margin erosion
  • Salesforce enablement
    Training and equipping commercial teams to communicate value, negotiate effectively and adhere to pricing rules
  • Performance management
    Tracking realised prices, discounting patterns and profitability impact to drive continuous improvement

Pricing as the key differentiator of financial performance

In outsourced services, margins are often tight, with high fixed costs and intense competition eroding profitability. Pricing therefore represents a uniquely powerful lever for value creation. A strategic pricing model can support volume expansion by using introductory pricing to win footholds in new accounts, or accelerate adoption of new service lines. It can also improve profitability in mature services, ensuring providers capture a fairer share of the value they deliver, while maintaining customer trust.

Ultimately, in an environment where scale and efficiency are table stakes, pricing can be the differentiator between average and exceptional performance. 

Please do reach out to me or my colleagues at L.E.K. to find out more. 

L.E.K. Consulting is a registered trademark of L.E.K. Consulting. All other products and brands mentioned in this document are properties of their respective owners. © 2025 L.E.K. Consulting

English
Subscribe to