Meeting the Chief Supply Chain Officer’s New Mandate: AI-Enabled Supply Chains for Profitable Growth

December 16, 2025

As featured speakers at a recent CSCMP session, Chuck Reynolds and Matt Stanfield examined the evolving mandate of today’s Chief Supply Chain Officer (CSCO) and the need for supply chains to adapt rapidly amid disruption and the rise of AI.

The conversation highlighted that CEOs now expect supply chains to deliver profitable growth, resilience and sustainability at the same time. Speakers examined how AI, digital twins and unified data platforms are transforming planning, sourcing, manufacturing and delivery by enabling faster, more accurate and more integrated decision-making. Case examples showed tangible impact, including reduced inventory, improved forecast accuracy and enhanced customer experience.

The session also addressed organizational challenges such as resistance to AI adoption, the need for continuous model refresh and aligning digital investments with broader business strategy. The shift from cost-focused management to orchestrating adaptive, learning supply chain systems was a central theme, emphasizing the CSCO’s growing role in shaping enterprise-wide innovation and growth.

Missed the event? Watch the full discussion to learn how to prepare your supply chain for the future and unlock new value.

To learn more about how L.E.K. can support your digital supply chain transformation, please contact us.

L.E.K. Consulting is a registered trademark of L.E.K. Consulting LLC. All other products and brands mentioned in this document are properties of their respective owners. © 2025 L.E.K. Consulting LLC 

English
Executive Insights

Commercial Excellence: 3 Insights for AEC and HVAC Services and Distribution Leaders

December 16, 2025

Key Takeaways

High-growth heating, ventilation and air conditioning (HVAC) and architecture, engineering and construction (AEC) firms deepen their customer focus and elevate productivity with analytics and enablement to guide sellers toward the right opportunities.

Compensation models across HVAC and AEC are steadily shifting toward greater variable pay as organizations tie incentives more directly to measurable performance.

The strongest commercial returns come from enhancing analytics, digital lead generation, and sales enablement, supplemented in some sectors by adding sales reps or expanding service lines.

As a result, sales teams continue to report gaps in segmentation, resource deployment and lead flow, underscoring the need for better targeting and stronger support tools.

Within building and infrastructure services, commercial excellence is how teams turn day-to-day activity into steady growth. To separate signal from noise, L.E.K. Consulting surveyed and interviewed U.S. sales executives and frontline sellers across HVAC distribution, HVAC commercial services and AEC firms. Three insights stood out, along with practical implications for leaders.

1.High-growth organizations deepen, rather than dilute, their customer mix and focus on productivity

High-growth firms (defined as those with growth at or greater than 15% annually) reflect a similar balance between new and existing customer contributions. However, while the source of growth looks the same, execution makes the difference. Teams that spend time on the right prospects, strip out low-value tasks and follow up consistently generate greater revenue as a result (see Figure 1).

Figure 1

Key sales activity metrics, by sales growth cohort (2024)

Image
Key sales activity metrics, by sales growth cohort (2024)

Figure 1

Key sales activity metrics, by sales growth cohort (2024)

Image
Key sales activity metrics, by sales growth cohort (2024)

Productivity sets the pace
High-growth companies manage more accounts and more leads per rep. They invest in capabilities that raise conversion and help sellers focus on the next best action. Teams use analytics to identify and rank opportunities, then apply training, coaching and enablement so sellers spend more time selling and less time searching. Leaders also devote less time to internal process upgrades that do not directly support sales performance. As a result, coverage widens, focus tightens and movement through the funnel becomes more predictable (see Figure 2).

Figure 2

All companies: Most successful/highest ROI areas for growing sales over the past three years, by growth performance cohort (2025)

Image
All companies: Most successful/highest ROI areas for growing sales over the past three years, by growth performance cohort (2025)

Figure 2

All companies: Most successful/highest ROI areas for growing sales over the past three years, by growth performance cohort (2025)

Image
All companies: Most successful/highest ROI areas for growing sales over the past three years, by growth performance cohort (2025)

These dynamics show up in the data. Enablement, analytics and fewer internal distractions link to stronger representative capacity and better lead handling across the pipeline. Analytics points to where to work, while enablement makes the work easier to execute.

The pattern repeats across categories. Even with differences by sector that reflect sales models and resource choices, the theme holds. When teams cover more ground without losing quality, growth rates improve and the mix between new and existing customers stays steady (see Figure 3).

Figure 3

AEC firms: Most successful/highest ROI areas for growing sales over the past three years (2025)

Image
AEC firms: Most successful/highest ROI areas for growing sales over the past three years (2025)

Figure 3

AEC firms: Most successful/highest ROI areas for growing sales over the past three years (2025)

Image
AEC firms: Most successful/highest ROI areas for growing sales over the past three years (2025)

HVAC distribution
Data analytics and sales enablement are important. Higher-growth distributors also highlight hiring additional salespeople, which supports broader coverage and faster response when quality leads surface. Adding head count sits alongside analytics and enablement rather than replacing them (see Figure 4).

Figure 4

HVAC distribution: Anticipated best use of funds for growing sales over the next three years (2025)

Image
HVAC distribution: Anticipated best use of funds for growing sales over the next three years (2025)

Figure 4

HVAC distribution: Anticipated best use of funds for growing sales over the next three years (2025)

Image
HVAC distribution: Anticipated best use of funds for growing sales over the next three years (2025)

HVAC commercial services
Analytics and enablement matter here as well. Leaders also emphasize hiring more salespeople and expanding product lines with supporting marketing. Expansion often reflects a broader service scope — for example, more electrical. HVAC and the broader MEP portfolio include a larger number of services that can be more complex than in many other categories, so clear communication helps customers see where the provider can help and when to engage.

AEC firms
Data and digital analytics are key differentiators. Sales enablement is less prominent because many AEC firms use a “seller-doer” model, in which technical practitioners both deliver and sell. Size differences are meaningful. Compared with large firms, small firms place much less emphasis on adding sales reps or investing in customer data and analytics. Emphasis on these disciplines positions larger firms for the longer term (see Figure 5).

Figure 5

AEC Firms: Most successful/highest ROI areas for growing sales over the past three years (2025)

Image
AEC Firms: Most successful/highest ROI areas for growing sales over the past three years (2025)

Figure 5

AEC Firms: Most successful/highest ROI areas for growing sales over the past three years (2025)

Image
AEC Firms: Most successful/highest ROI areas for growing sales over the past three years (2025)

Sales resources in AEC are often led by managers with engineering or technical backgrounds, which shapes how teams adopt analytics and business development processes and how seller-doers are supported (see Figure 6).

Success ties to the capacity to work more accounts and more leads. Better tools and analytics enable that capacity. Depending on the industry and the company setting, expanding the service offering and the number of sales reps may also be required.

Figure 6

Sales structure and management of seller-doer model for AEC firms (2025)

Image
Sales structure and management of seller-doer model for AEC firms (2025)

Figure 6

Sales structure and management of seller-doer model for AEC firms (2025)

Image
Sales structure and management of seller-doer model for AEC firms (2025)

2.Variable-heavy pay structures are accelerating

Companies are shifting compensation toward performance-based pay. Across all segments, fixed pay as a share of total compensation declined from 50% in 2022 to 45% in 2025 (see Figure 7). It is expected to slide to 41% by 2028. HVAC distributors are moving fastest. By 2028, 66% of compensation is expected to be variable. The trajectory points to a steady increase in the portion of pay tied to measurable results as organizations refine plan mechanics and clarify performance expectations.

Sales compensation structures are expected to keep shifting toward variable pay over the next three years, with respondents projecting a steady increase in the share tied to performance-based incentives. The aim is tighter alignment between sales incentives and outcomes as organizations emphasize growth, accountability and results-driven performance. In many cases, plans are being adjusted so effort, outcomes and pay are more visibly connected within the field.

Companies should direct more commission upside to the behaviors that matter most. Priorities include digital lead stewardship, AI adoption and strong data hygiene. Organizations should also maintain enough base pay to retain talent during slower cycles, so teams remain stable and ready to respond when demand strengthens.

Figure 7

Sales representative compensation structure over time (2025)

Image
Sales representative compensation structure over time (2025)

Figure 7

Sales representative compensation structure over time (2025)

Image
Sales representative compensation structure over time (2025)

3.Industry sales teams highlight significant room for improvement in sophistication of customer segmentation, organization of commercial resources and deployment, lead generation, and supporting processes and tools

We asked sales teams and sales leaders across HVAC distribution, HVAC commercial services and AEC firms to rate their organizations’ commercial capabilities. The results signal significant room for improvement, especially around commercial team design, deployment, and providing stronger support around targeting and lead flow so sellers can spend more time with customers.

Across companies, the sales force is asking for more central support. Priority areas are customer segmentation, resource allocation, lead generation, and the processes and tools that connect these activities. Results vary by industry, but the message is consistent: Sharper targeting, better leads and smoother workflows help the frontline operate at a higher level. When support functions provide cleaner data and clearer handoffs, sellers can spend more time with customers and less time on administration, which reinforces the productivity focus described above. (See Figure 8).

Outside of these broad themes across companies, we saw divergence in the data among respondents: Many companies had a particular “blind spot” in their overall support that can be a distracting gap for the sales force.

Figure 8

Sales force self-assessment of current practices and opportunities for improvement

Image
Sales force self-assessment of current practices and opportunities for improvement

Figure 8

Sales force self-assessment of current practices and opportunities for improvement

Image
Sales force self-assessment of current practices and opportunities for improvement

Our Commercial Fitness Assessment Survey helps organizations benchmark performance against market averages and focus attention where it matters. Even when sales force effectiveness is generally strong, it is important to identify gaps and their root causes, and then address them in a deliberate sequence, so improvements directly enhance conversion or coverage.

Implications

Commercial excellence in the built environment is not about adding more feet on the street. Progress depends on smarter digital funnels, data-driven prioritization and rewards tied to performance. With that in mind, leaders should gauge the voice of the frontline at a regular cadence to surface bottlenecks and support gaps, and then turn those insights into targeted enablement and marketing support.

Leaders should focus on sales enablement, including tools and training supported by powerful analytics, and on hiring better sales enablement or business development personnel to identify and qualify leads, so representatives can manage more opportunities without harming the customer experience. In some instances, companies may need to hire more representatives to support activity. Compensation design should align pay with outcomes by reflecting the growing role of variable pay and directing the strongest upside to the behaviors that sustain growth.

For more information, please contact us.

L.E.K. Consulting is a registered trademark of L.E.K. Consulting LLC. All other products and brands mentioned in this document are properties of their respective owners. © 2025 L.E.K. Consulting LLC

English

Lorem ipsum dolor sit amet, consectetur adipiscing elit. Praesent et tincidunt sem.

December 10, 2025

Test image caption

Testing description here Testing description hereTesting description her Testing description here.

Image

Fig Caption here

Test image caption

Testing description here Testing description hereTesting description her Testing description here.

Image

Fig Caption here

A quote someone said long ago

Image
Test image

Someone

President FLC

3000+

Users

4k+

Views

$70M

Sales

50M

Visitors

English

From Break/Fix to Booked: How Smarter Pricing Can Create Value in Automotive Repair

December 11, 2025

Car wash subscriptions show how fixed-capacity service businesses can turn time into money. With the right price architecture, mechanical repair can do the same via recurring revenue, dynamic scheduling and value-led ancillaries.

A changing industry with old pricing habits

Mechanical automotive repair has modernized in many ways, but one area is notably behind: revenue design. 

Over the past decade, the category has consolidated rapidly, with multisite operators (MSOs), many private equity backed, controlling a growing share of bays and technicians and providing centralized scheduling, common parts procurement and increasingly uniform customer experiences. 

Dealership service lanes, meanwhile, have digitized appointment flows and customer communication and are competing aggressively for retention as vehicles age out of warranty.

Yet most shops — independent, dealer or MSO — still price as if every job were a bespoke event. A car breaks, the customer books, the shop diagnoses and the final ticket depends on what is discovered. In an inflationary environment where parts and labor costs keep climbing and technician supply is structurally tight, this reactive “break/fix” model leaves profit to chance. 

Peaks and troughs in demand go unpriced. Technician hours, which are the scarcest asset in auto service, go unused in slow periods. And customer relationships remain episodic and price-anxious rather than durable and value-assured.

While MSOs can test and scale new price architectures across dozens or hundreds of locations, even single-site independents and dealership lanes can adopt a different philosophy to pricing with a goal of converting uncertainty into value for the customer and converting time into money for the operator.

What the customer is telling us

Three realities from L.E.K. Consulting’s recent 3,000-person survey on services pricing set the stage.

First, mechanical repairs are essential but infrequent (see Figure 1). Most consumers use repair services annually or “as needed,” and 79% report no change in frequency year over year; while the need is stable, the timing is unpredictable. 
 

Image
Figure 1. Usage frequency
Image
Figure 1. Usage frequency

DIY feasibility is low: 60% of respondents rate completing repairs themselves as difficult or very difficult, and respondents cite lack of expertise (74%), lack of tools (70%) and safety (54%) as the top reasons to seek professional help.

Second, price expectations are about fairness and clarity, not just low numbers. Customers want up-front pricing wherever possible; that preference is strong across consumer segments and is particularly acute among those who consider themselves more proficient with their vehicle.

Third, the willingness to pay exists, but only if value is visible. Median reported spend for a one-time repair is $225, and tellingly, approximately 32% say they paid more than their personal “beginning to get expensive” threshold. 

At a hypothetical 10% price increase, about 40% would not change their behavior, while the rest would reduce frequency, switch, do it themselves or opt out. Blanket hikes are risky, but value-led design has room to run.

At the attitudinal level, service quality, affordability and transparency are the most important purchase criteria as well as the drivers of advocacy (see Figure 2). Providers generally perform well on these elements, suggesting people have found shops they are happy with and providing a strong base on which to build.

Image
Figure 2. Popular reasons to purchase mechanical repair services*
Image
Figure 2. Popular reasons to purchase mechanical repair services*

What the car wash teaches (and what must be translated)

Car washes sit at the opposite pole : They are high-frequency, highly repeatable, inherently “tierable.” Even so, the car wash offers two lessons that travel well: Certainty sells, and tiering unlocks a willingness to pay. Subscriptions have grown among heavy users because they trade uncertainty (weather, habit, hassle) for a predictable, always-on entitlement and a perception of savings. And simple good-better-best menus let customers self-select at the point of need.

Mechanical repair cannot copy “all you can repair” as the frequency and task variability won’t support it. But it can translate the principles to a repair-appropriate construct including assured access and predictable minor-cost coverage, time-based offers that smooth capacity and value-creating ancillary offers (see Figure 3).

Image
Figure 3. Recently purchased pricing models*
Image
Figure 3. Recently purchased pricing models*

Three potential levers that convert time to money

1. Subscriptions and recurring revenue: a “wellness plan” for your car

The centerpiece is a membership that exchanges steady monthly spend for booking certainty and value clarity. The extended warranty and other finance & insurance (F&I) products are already well established in the industry but, beyond the dealership relationship, exist above the level of the individual service provider and are predominantly for new vehicles. Full warranties, however, are sold products and leave a gap in the mass middle of the market. 

Enter the wellness plan construct where service providers could fill this gap:

  • Basics are covered: periodic checkups, digital inspections, two oil changes a year, tire rotations, fluid top-offs
  • Major work is subsidized, not free: a published copay schedule (e.g., first $200 covered on brake jobs, 15% labor discount on major repairs) that preserves economic discipline
  • Priority access is ensured: earlier booking windows, fast-track diagnosis slots or members-only shoulder pricing
  • Pricing certainty is explicit: a 12-month labor-rate freeze and waived diagnostic fee once per year for members

The benefits align with what consumers value (quality, fairness, transparency) and what operators need: recurring revenue, a higher visit cadence and structured authorization that reduces friction during repair-order build. 

The key for any plan is to include the table stakes features that drive adoption, use the relationship to capture the larger “filler” that drives higher costs and avoid “killer” features that bloat the program. 

Of course, plans like this aren’t for everyone and would have to coexist with more transactional relationships, but the lifetime value benefits could be material, and our research suggests that as many as 18% of regular service users find it attractive, compared to 16% of average users finding subscriptions/memberships attractive.

2. Dynamic pricing and time-based scheduling: smoothing the bays

Technician hours are the perishable inventory. Demand clusters by day and season, with Mondays and Fridays often hot but midweek afternoons slack. The goal is not surge pricing but value-differentiated timing:

  • Off-peak incentives for movable jobs (diagnostics, oil changes, alignments)
  • Members-only shoulder pricing or extended “at the shop” time to nudge the actual work into slack windows
  • Network-level routing (for MSOs) that offers earlier availability nearby, sometimes at a small price advantage

A small discount that fills an otherwise idle bay is pure contribution, and over a network, the impact compounds.

3. Ancillary revenue: making more of every visit

Multipoint inspections are already common in the industry as safety-critical work is surfaced and additional potential work identified. But maximizing the value here requires a suite of non-bay or short-bay services that add value without clogging technician time. If not already offering these, there are a number of products and services that may be relevant:

  • Paintless dent repair, cosmetic touch-ups for wheels, headlight restoration, windshield chip repair
  • Advanced driver-assistance system (ADAS) calibrations
  • Retail consumables (wipers, filters, detailing kits)

These add-ons can lift the average ticket and, if done right, give consumers access to services they value and drive increased satisfaction.

The road ahead: Engineer predictability into an unpredictable business

Mechanical repair shops are effectively factories of skilled labor. Every hour is a perishable asset. When sold reactively, value leaks through idle bays and customer anxiety. The car wash industry solved a similar problem through tiering, subscriptions and transparent upsell.

The translation for mechanical repair is straightforward: assured access and coverage, value-differentiated timing and convenience-led ancillaries. MSOs can implement at scale with multisite memberships and network-aware scheduling. Dealerships can use the same principles to retain postwarranty customers. Even single-site independents can capture value through simpler versions.

The industry has invested in diagnostics, tooling and digital booking. The next differentiator is pricing intelligence, meaning the discipline to align perception, capacity and profitability. The car wash taught customers to subscribe to cleanliness. Mechanical repair can teach them to subscribe to confidence and, in so doing, turn unpredictability into a managed source of value creation.

Contact us to learn how smarter pricing models can help mechanical repair operators unlock capacity, strengthen margins and elevate customer value.
 

L.E.K. Consulting is a registered trademark of L.E.K. Consulting LLC. All other products and brands mentioned in this document are properties of their respective owners. © 2025 L.E.K. Consulting LLC

English

Car Wash Pricing: Filling Tunnels and Maximizing Value in a Fixed-Capacity Industry

How a familiar consumer service offers enduring lessons in pricing, subscriptions and revenue design for inflation-challenged, capacity-constrained businesses.
December 11, 2025

A professionalized industry meets a new reality

Few local service sectors have attracted as much private equity interest as car washing. A fragmented, owner-operator market has been reshaped by sophisticated chains, improved branding and data-driven management. Investors saw predictable demand, scalable operations and repeatable returns.

Yet this wave of professionalization now faces a tougher equation. Inflation in labor, chemicals and utilities, coupled with rising land and capital costs, has compressed margins. Meanwhile, competition remains intensely local, with core prices highly visible from the street.  

Driving profitable same-store growth is harder than ever. Operators can no longer rely on throughput alone or blanket price increases. Instead, the winners will be those who use precise pricing architecture and membership design to optimize yield from a finite inventory of tunnel time — monetizing every hour of capacity while maintaining customer value perception.

The car wash market therefore serves as a broader case study in how fixed-capacity services — whether gyms, pet grooming or site-based leisure — can use tiering, transparency and subscriptions to balance utilization and profitability. As part of a quantitative study of consumer service users, which captured perspectives from over 3,000 U.S. consumers, we picked apart insights about the car wash market and how it compares to other services.

A lifestyle luxury that functions like a staple

Car washing occupies a unique emotional space: a small luxury that saves time. Half of consumers say they could wash their car themselves, but most choose not to. Survey data shows time savings (54%), lack of equipment (47%) and superior results (45%) as the top purchase drivers, ahead of “treat myself” motivations (41%). DIY difficulty averages 3.4/7, suggesting consumers recognize that it is, of course, feasible to wash a car at home, but also inconvenient.

Frequency is high and stable: Around one in five customers wash weekly or more frequently; nearly half wash one to three times a month; and three-quarters report no change year over year (see Figure 1). 

Image
Figure 1. Usage frequency
Image
Figure 1. Usage frequency

Even in a cost-conscious environment, a car wash remains a habitual purchase because it delivers both convenience and satisfaction (see Figure 2). This reliability gives operators a steady demand base — but also heightens expectations around fairness and value.

Image
Figure 1. Usage frequency
Image
Figure 1. Usage frequency

How consumers define value

When choosing a provider, consumers emphasize service quality (84%), affordability (78%) and price transparency (76%). Speed and timeliness follow. Derived-importance analysis reveals deeper drivers: Prior experience, breadth of services and brand reputation are stronger predictors of advocacy than their stated ranks imply.  

In essence, customers “buy the wash” but recommend the brand that feels reliable and complete. Encouragingly, satisfaction scores show providers performing well on value for money, suggesting that current menus and price points are appropriately calibrated (see Figure 3).

Image
Figure 3. Importance vs. performance on key purchase criteria*
Image
Figure 3. Importance vs. performance on key purchase criteria*

An equilibrium worth protecting

Across segments, consumers find different value in the car wash with high-frequency customers, and particularly those who are subscribers/members perceiving a higher value relative to the amount they paid.  However, average and low-frequency consumers are more value-challenged, indicating some price elasticity risk with this group (see Figure 4).
 

Image
Figure 4. Price-to-value comparison of car wash services, by consumer segment*
Image
Figure 4. Price-to-value comparison of car wash services, by consumer segment*

This elasticity is consistent with how consumers say they will react to a price increase. On this stated basis, a 10% price increase would prompt roughly one in five consumers to reduce frequency, 16% to switch or trade down, and another quarter to DIY or stop entirely. While behavior is likely overstated, the fact that only 4 in 10 say they would continue unchanged does suggest real revenue risk from across-the-board price increases (see Figure 5).

Image
Figure 5. Change in behavior for car wash services given price increases
Image
Figure 5. Change in behavior for car wash services given price increases

The implication is clear: The entry-level wash anchors demand. It must remain competitively priced to sustain traffic. The path to profitable growth lies not in pushing the floor up but in pulling the ceiling higher through tier upgrades, memberships and add-ons.

Tiers and transparency: The cornerstones of pricing architecture

The modern car wash has embraced simple, outcome-based tiers — “Clean,” “Protect,” “Shine” — that let consumers self-select. Roughly 63% of recent purchases are single, up-front transactions, reflecting the importance of a visible, no-commitment entry point.

Among high-frequency users, however, subscriptions are key. These customers see the logic of locking in unlimited access and eliminating decision friction. They cite better value and access to premium features as primary reasons to join.

For nonmembers, certainty and trial matter most. Offers such as a first-year price lock, one-month free or one-week trial significantly increase willingness to subscribe without cheapening the product (see Figure 6).

Image
Figure 6. Pricing model by frequency and subscription drivers*
Image
Figure 6. Pricing model by frequency and subscription drivers*

The message for operators:

  • Maintain a clear, attractive single-wash offer.
  • Use transparent good-better-best tiers to capture willingness to pay.
  • Deploy subscription and “lite” membership variants to segment frequency and valued features to stabilize revenue.

Monetizing the moment: Bundles and attach

Beyond memberships, add-ons and bundles provide meaningful upside (see Figure 7). Around 58% of customers have been offered extras, and 70% express interest when prompted. The highest-impact items are those that extend the feeling of quality: interior quick detail or vacuuming, wax/shine coatings and tire treatments.

Image
Figure 7. Add-on interest and uptake*
Image
Figure 7. Add-on interest and uptake*

Some operators go further, linking with adjacent categories. Convenience stores will often bundle a car wash with a fuel purchase discount for their loyalty members. The principle generalizes to freestanding car washes: When add-ons are relevant, quick and visibly priced, they reinforce perceived value while increasing ticket size.\

Strategic priorities for operators

While individual market dynamics vary, several imperatives are consistent across networks and independents alike:

  • Protect the entry
    Keep the base wash accessible and clearly priced; it anchors fairness and drives funnel volume.
  • Clarify the ladder
    Use outcome-based tier names and concise visual design to guide trade-ups.
  • Match membership to behavior
    Focus unlimited tiers on high-frequency users; pilot “light” versions for moderate ones; use fixed-price guarantees and free trials to acquire new subscribers.
  • Productize add-ons
    Standardize add-ons — vacuuming, wax, interior detail — so staff can upsell consistently and customers can see value instantly.
  • Govern locally
    Benchmark competitors quarterly. Adjust benefits first, pricing last.

Lessons for other fixed-capacity services

The car wash model underscores three enduring truths about modern service pricing:

  • Tiering and transparency enable choice and create trust. Clear choices reduce friction and invite self-selection.  
  • Memberships thrive on frequency. Predictable users value commitment; occasional users require flexible options.  
  • Add-ons complete the experience. Complementary services lift satisfaction and yield without alienating price-sensitive segments.

Across industries, inflation and fixed-capacity demand the same response: Engineer value, don’t just price it. While there is still variation across the industry, high-performing car wash operators, through disciplined menu design, smart memberships and careful price governance, have been able to keep tunnels and cash flow full.

Contact us to learn more about how lessons from the car wash industry can help transform your pricing model, protect margins and elevate customer value.

L.E.K. Consulting is a registered trademark of L.E.K. Consulting LLC. All other products and brands mentioned in this document are properties of their respective owners. © 2025 L.E.K. Consulting LLC

English

Why Value Creation Is the Prescription for the Private Hospital Sector

December 8, 2025

Ageing populations, staff shortages and a growth in chronic conditions, combined with major structural issues, are putting pressure on Europe's healthcare system.
This infographic highlights the megatrends driving disruption across demand, funding and supply, and identifies the levers that enable lasting value creation. 

Download the PDF now to explore how leading hospital operators are redefining value in European healthcare.

Why Value Creation Is the Prescription for the Private Hospital Sector


L.E.K. Consulting is a registered trademark of L.E.K. Consulting LLC. All other products and brands mentioned in this document are properties of their respective owners. © 2025 L.E.K. Consulting LLC

English

Powering Forward: 2025 Energy Transition Snapshot

December 5, 2025

L.E.K. Consulting’s 7th Annual Global Energy Study, with insights gained from more than 300 senior executives worldwide, reveals how spending priorities are fragmenting across oil and gas (O&G), utilities and renewables as leaders balance ambition with execution realities.

This infographic distills this year’s survey data, and will be accompanied by articles on grid resilience, AI adoption and flexibility in energy infrastructure.

Read the first article in the series here: Powering Foward: Energy’s Next Phase.  


Powering Forward: 2025 Energy Transition Snapshot


L.E.K. Consulting is a registered trademark of L.E.K. Consulting. All other products and brands mentioned in this document are properties of their respective owners. © 2025 L.E.K. Consulting

English
Executive Insights

L.E.K. Consulting’s 2025 Office of the CFO Survey: A Study of AI in the OCFO

December 3, 2025

Key takeaways

Approximately 60% of CFOs believe AI will be one of the most impactful technologies in the OCFO, yet only about 11% use it within their finance functions today while around 35% are just beginning to experiment with pilots or proofs of concept.

About 25% of respondents already use AI-powered features within third-party software, and an additional ~44% plan to do so within the next three to five years.

As adoption begins to take hold, CFOs using AI report clear gains in productivity, work quality and cost reduction, with AP and AR tasks shortened significantly.

Ultimately, roughly 56% of CFOs prefer embedded AI within finance platforms, while over ~31% still favor best-in-class point solutions.

Artificial intelligence (AI) has captured the attention of chief financial officers (CFOs), but most are still navigating its early promise with measured caution. L.E.K. Consulting’s Annual 2025 Office of the CFO (OCFO) survey, based on input from over ~100 CFOs, reveals a landscape where strategic intent far outpaces operational reality. Despite AI’s potential to reshape forecasting, automate transaction-heavy workflows and elevate finance into a more strategic function, current adoption remains modest. We conduct a comprehensive OCFO survey annually, capturing views on what’s top of mind for CFOs. This year, we captured feedback from over ~100 CFOs across multiple industries.

The next few years, however, are set to define a turning point. Early adopters are already achieving measurable efficiency gains, especially in areas like accounts payable (AP), accounts receivable (AR) and financial close. Others are looking to embed AI capabilities within platforms to do the heavy lifting as tech stacks consolidate and expectations for decision intelligence grow.

For finance software vendors, platform providers and private equity investors, the implications are significant: The opportunity lies not in evangelizing AI’s potential but in demystifying its implementation, solving for integration and proving its return on investment (ROI) in practical finance applications.

The current state of AI adoption in the OCFO

Our 2025 survey reveals that approximately 60% of CFOs believe AI is going to be one of the most impactful technologies in the OCFO over the next years (up from roughly 50% in 2024). Furthermore, 54% of CFOs think that delaying the adoption of AI will slow their organization’s ability to grow.

Yet only about 11% of CFOs are using AI within their finance functions today, while around 35% are just beginning to experiment with AI in pilots or proofs of concept (see Figure 1).

Figure 1

Importance and current adoption of AI

Image
Importance and current adoption of AI

Figure 1

Importance and current adoption of AI

Image
Importance and current adoption of AI

CFOs who have adopted AI are reporting strong impacts across productivity, work quality improvements and cost reduction (which remains a top priority for CFOs in 2025). AI is playing a central role in enabling these outcomes by automating time-intensive processes, improving data accuracy and freeing teams to focus on higher-value activities. In productivity, AI is accelerating critical workflows like financial close, cash flow forecasting and invoice processing. In terms of work quality, AI-driven tools are enhancing forecasting precision, improving reconciliation processes and enabling more-informed data-rich decisions.

“... [AI] flags anomalies and helps us pinpoint variances faster, which has cut down our month-end timeline and frees up our team to focus on more analytical work ...
— CFO, energy software and analytics company

On the cost side, AI is helping cut labor-intensive, repetitive tasks, particularly in AP, AR and financial planning functions. For CFOs navigating tight budgets and economic uncertainty, these efficiencies are proving not just beneficial but essential (see Figure 2).
 

Figure 2

Improvements enabled by AI within finance/accounting activities

Image
Improvements enabled by AI within finance/accounting activities

Figure 2

Improvements enabled by AI within finance/accounting activities

Image
Improvements enabled by AI within finance/accounting activities

Where is AI being used today?

Among those using AI, three areas stand out (see Figure 3):

  • AP/AR automation: CFOs reported strong results from implementing AI to handle invoice ingestion, payment routing and reconciliation.
    “... We’ve seen a real lift in AP and AR productivity. A task that used to take three hours now takes 15 minutes. The team is no longer stuck processing invoices the whole day ...”
    — CFO, global produce distributor
  • Budgeting and forecasting enhancement: CFOs are using AI to streamline budget creation and scenario planning, with tools that dynamically adjust forecasts based on shifting inputs, improving accuracy and enabling faster, more-informed decision-making.
    “... We’ve started to use the built-in AI in our financial planning and analysis (FP&A) tool to surface anomalies and guide our forecast reviews. It helps us know where to dig in, which is huge when you’re moving quickly ...”
    — CFO, energy software and analytics company
  • Cash flow forecasting: Predictive AI models are helping finance teams run dynamic cash flow scenarios faster, using historical patterns and real-time inputs. This can help drive stronger growth for businesses (in particular small and midsize businesses), as better cash flow data and predictability are expected to expand access to loans and credit.
    “... For cash flow management AI has greatly increased productivity, enabled better forecasting and lowered costs …”
    — CFO, multinational packaging manufacturer

Figure 3

Effectiveness of AI-driven features in finance/accounting third-party software

Image
Effectiveness of AI-driven features in finance/accounting third-party software

Figure 3

Effectiveness of AI-driven features in finance/accounting third-party software

Image
Effectiveness of AI-driven features in finance/accounting third-party software

Yet these pockets of progress are the exception and not the rule. For most finance teams, AI remains in a pilot phase or limited to generic generative AI (GenAI) use cases like reading PDFs or summarizing transcripts. 
“... We’ve been experimenting with ChatGPT to summarize meeting notes and transcripts, but for accounting? We’re not anywhere near there ...”
— CFO, adtech platform company

So why is AI adoption still limited?

Despite growing enthusiasm for AI’s potential, widespread adoption within the OCFO remains uneven (see Figure 4). While early adopters report clear productivity and efficiency gains, many finance leaders are still sitting on the sidelines. Adoption remains constrained by several barriers, including:

  • Awareness and education gaps: Many CFOs struggle to articulate what AI solutions are available and how capable they are, making it difficult to assess potential ROI or justify investment.
    “... We’re interested in AI, but right now it feels like we don’t know what we don’t know. It’s hard to evaluate whether these tools would provide a reasonable ROI if we’re not even sure what’s out there or what they can realistically do ...”
    — CFO, adtech platform company
     
  • Integration challenges: Fragmented systems, particularly among midsize firms using multiple point solutions, make implementation difficult.
    “... Our ERP [enterprise resource planning] is a bit dated; we’d love to implement AI tools for invoice reading and reconciling, but we don’t have the ability today to do the right integrations. That’s the biggest blocker for us. It’s not the tool; it’s connectivity ...”
    — CFO, home furnishings retailer
  • Risk aversion and trust barriers: CFOs are historically cautious adopters, especially of AI, citing concerns about data accuracy, explainability and the risk of hallucinated outputs in financial decision-making.
    “... For AI to really be valuable, it needs to be accurate and explainable. We’re not willing to risk using tools that work in a black box to make decisions that impact our financials ...”
    — CFO, enterprise IT expense management provider

Figure 4

Top barriers to AI adoption in the OCFO

Image
Top barriers to AI adoption in the OCFO

Figure 4

Top barriers to AI adoption in the OCFO

Image
Top barriers to AI adoption in the OCFO

The near-term outlook on OCFO AI uptake

The near-term outlook for AI adoption within the OCFO is optimistic. While just 33% of respondents have used off-the-shelf GenAI solutions within the past 12 months, an additional roughly 20% plan to do so in the next three to five years. Even more striking is that while only about 25% of respondents currently use AI-powered features within third-party software, an additional approximately 44% plan to do so in the next three to five years, suggesting a preference for low-friction, integrated OCFO solutions over stand-alone tools. Investments and efforts are also expected to grow across AI governance and employee AI upskilling. Taken together, these shifts reflect a maturing mindset of moving from experimentation to more-structured, long-term investment in AI across multiple layers of the finance function (see Figure 5).

Figure 5

CFO AI plans in the past 12 months vs. next three to five years

Image
CFO AI plans in the past 12 months vs. next three to five years

Figure 5

CFO AI plans in the past 12 months vs. next three to five years

Image
CFO AI plans in the past 12 months vs. next three to five years

“... I think it’s going to be more important than ever to have technologies that give us the ability to make decisions, good decisions, quickly. We are data-rich and information poor, and that’s a real problem …”
— CFO, regional health system

AI’s impact on head count: Reallocation, not just reduction

One of the most-debated impacts of AI within the OCFO is its effect on the finance team head count. While relatively few CFOs report job losses to date, the majority anticipate this will shift meaningfully over the next few years. By 2028, most finance leaders expect a clear evolution of how teams are structured and in the nature of the roles required (see Figure 6).

In March 2025, EY launched its EY.ai Agentic Platform in partnership with NVIDIA, aiming to transform core tax, risk and finance operations. The firm has already deployed 150 AI agents across 80,000 tax professionals to automate data collection, document review and compliance workflows. While positioned as an augmentation strategy rather than a replacement, the scale of automation points to a potential near-term reality where future finance teams will be leaner, more tech-enabled and focused on oversight and analysis rather than execution.

Figure 6

Impact of AI on finance head count

Image
Impact of AI on finance head count

Figure 6

Impact of AI on finance head count

Image
Impact of AI on finance head count

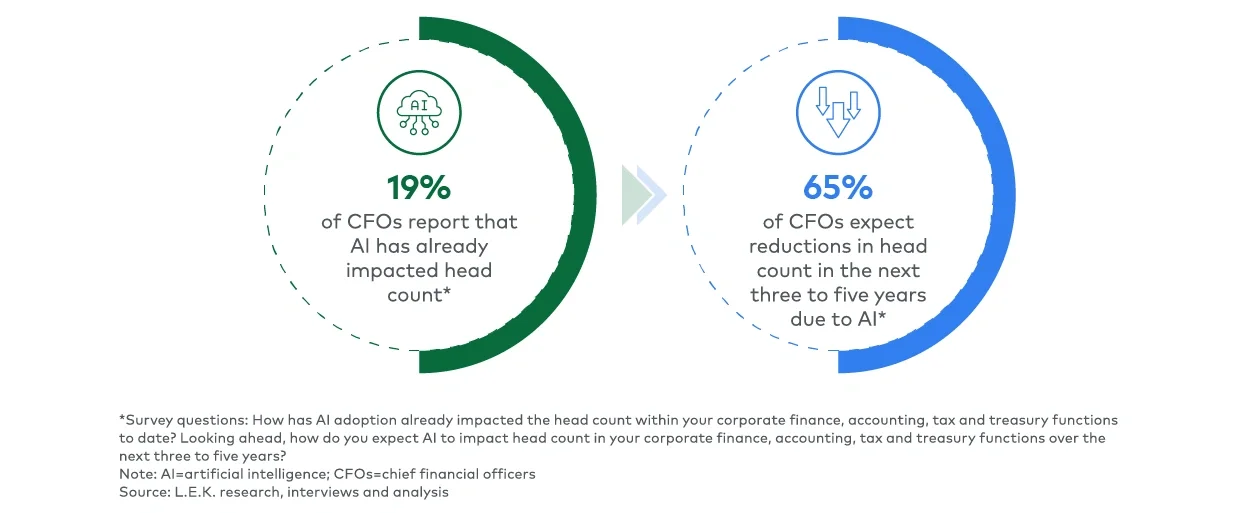
Transactional functions such as invoice processing, journal entry posting, reconciliations and other repeatable, rules-based tasks are seen as the most vulnerable. AI-powered tools are already proving capable of executing these activities faster, more accurately and at a lower cost than traditional human-led processes. As adoption scales, many CFOs anticipate downsizing or redeploying staff who are currently focused on these operational areas.

“... I think in three to five years, finance teams will be smaller and smarter. Repetitive work will be owned by AI, while people focus on complexity and strategy ...”
— CFO, multinational packaging manufacturer


At the same time, demand is expected to grow for more strategic, analytical and decision-support roles — in particular, talent that can help interpret AI outputs, apply financial judgment and collaborate cross-functionally with business partners in other departments and organizations. These roles will be less about processing information and more about extracting insights and shaping forward-looking decisions in line with the continued evolution of the OCFO to more strategic functions.

“... Anything that’s considered manual or time-consuming, where you’re having to input data in a traditional data entry format, AI is going to replace and speed up the process ...”
— CFO, real estate firm


For CFOs, this creates both an opportunity and a challenge: To redesign team structures, invest in new skills and ensure that technology and talent evolve in tandem to meet the needs of the modern finance function.

Embedded AI > stand-alone AI

The overwhelming majority of CFOs express a strong preference for AI capabilities that are embedded within broader finance or ERP platforms rather than delivered as stand-alone tools. This preference is rooted in practical realities that finance leaders face today:

  • Ease of adoption: Embedded AI features typically require less effort to implement, configure and integrate with existing workflows. Because they’re native to systems already in use, embedded capabilities deliver faster time to value with fewer IT dependencies. For many CFOs, this approach feels less like adopting a new tool and more like a version upgrade of systems they’ve already invested significant time and effort into building. It preserves familiar workflows and interfaces, which is especially important for a group that tends to be risk-averse and highly attuned to operational disruption. In contrast, stand-alone AI tools often come with steep onboarding curves, data integration challenges and greater change management overhead, making them often feel like a wholesale restart rather than an evolution.
  • Data consistency and integrity: Platforms with integrated AI features provide a single source of truth across functions, enabling AI to operate on consistent, up-to-date data. This is critical for CFOs aiming to maintain accuracy and trust in their reporting, forecasting and analysis. Siloed tools can create gaps, redundancies or inconsistencies that undermine the reliability and trust in AI-driven insights.
  • Vendor rationalization: Most CFOs are actively looking to reduce, not expand, the number of vendors they manage. Platform consolidation helps simplify vendor relationships, reduce licensing complexity and improve accountability for performance and support.

This strong preference for embedded AI reflects a broader trend toward platform consolidation across the OCFO. In fact, roughly 56% of survey respondents report that they prefer platform solutions, while over ~31% prefer best-in-class point solutions (about 13% were neutral).

“... We’re already seeing convergence in tools offered; some vendors are adding capabilities to become more of a platform because they know CFOs want fewer systems and tighter integrations ...”
— CFO, energy software and analytics company
 

Strategic implications for solutions providers and investors

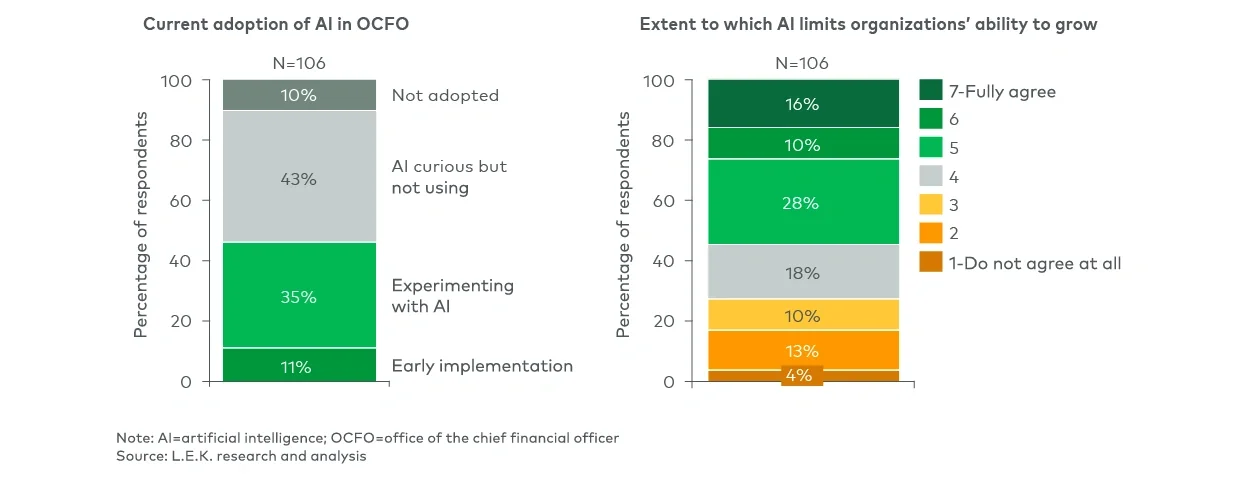
The implications are clear: While AI adoption is still in its early stages in the OCFO, demand is growing and expectations are rising. For vendors and investors alike, this means:

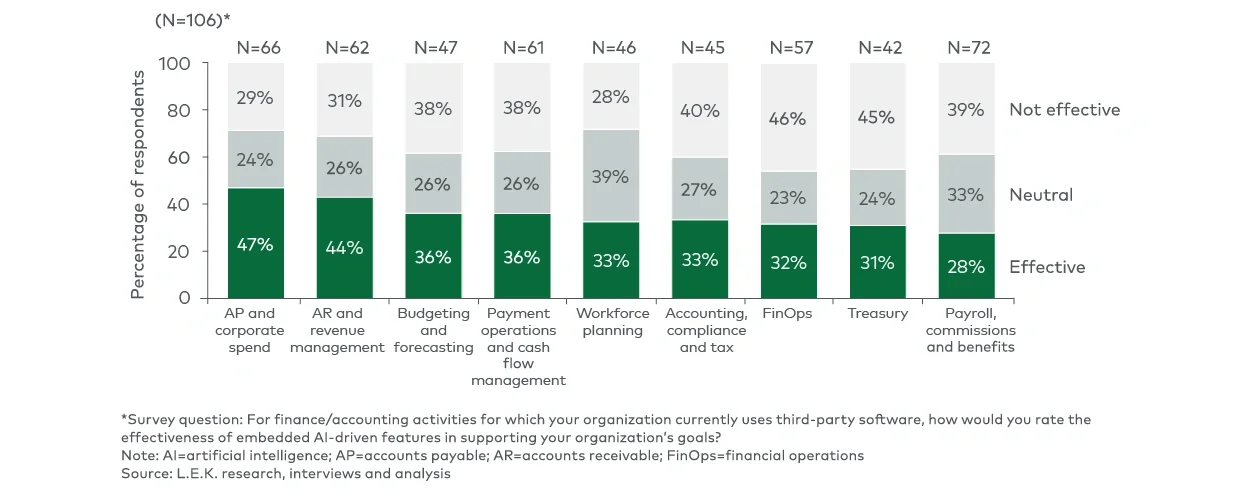
  • Focusing on real use cases, not futuristic promises: CFOs need solutions that drive ROI today, particularly for AR/AP, budgeting and forecasting, and cash flow management.
  • Prioritizing embedded AI within platforms: Tools that require separate implementation or learning curves will face resistance. Winning solutions will “just work” inside the stack.
  • Supporting education and changing management: Vendors must take the lead in demystifying AI, show real benchmarks and ease finance teams into adoption.
  • Being ready to scale: The next wave of AI adoption will likely happen fast, especially once leaders start seeing results from peers.

Strategic implications for CFOs

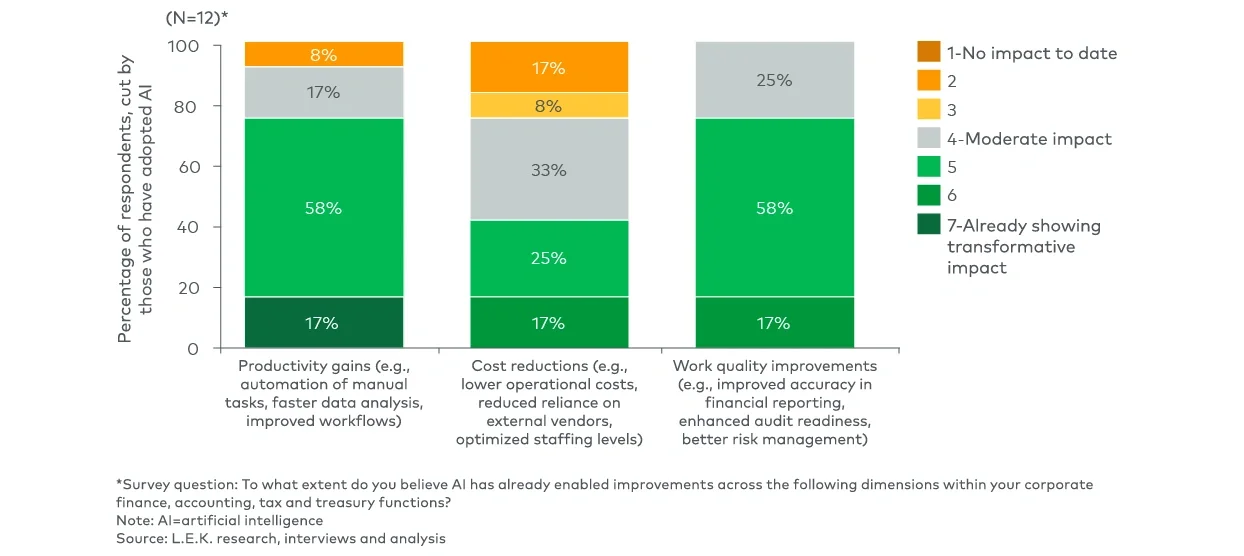
For CFOs, the question is no longer whether AI will reshape the function — it’s how quickly and where to start. Across early adopters, one clear theme is emerging: The path forward is grounded in practical, operational wins, not sweeping transformation. AP and AR are proving to be fertile ground for early experimentation and are areas where CFOs can quickly realize time savings, improve accuracy and reallocate capacity to higher-value tasks.

CFOs who lean in will need to play the roles of both architects and change agents. Architects, in the sense that AI adoption, whether embedded in ERP systems or enabled through third-party applications, will require thoughtful coordination across finance, IT and the broader organization. And change agents, because success will depend not only on selecting the right tools but also on guiding teams through new workflows, building trust in AI-generated outputs and upskilling talent accordingly.

Most importantly, AI will reshape, not replace, the finance workforce. Transaction-heavy roles are already being automated, with many CFOs reporting a shift toward leaner teams supported by more strategic and analytically focused talent. While head count impacts are expected, the greater challenge may be enabling remaining team members to move up the value chain, from data processors to insight generators.
To prepare, leading CFOs are:

  • Investing in finance-specific AI literacy
    Equipping teams to evaluate and implement AI tools confidently, not just use them passively
  • Prioritizing embedded AI
    Favoring tools already integrated into existing platforms, reducing the friction of adoption and maximizing data fidelity
  • Rewiring the operating model
    Realigning finance organization structures, responsibilities and key performance indicators to reflect a world where AI augments human judgment

For most finance leaders, the real risk is no longer doing too much too soon; it’s standing still. As peer organizations scale successful AI pilots, expectations for productivity, decision-making speed and cost efficiency will shift quickly. CFOs must ensure their teams are not only ready to keep up but positioned to lead.

Conclusion: The AI future is coming, but it’s embedded and practical

AI is no longer a buzzword — it’s a buy signal. But for most CFOs, adoption will come through trusted platforms, practical workflows and measurable results, not just flashy pilots or disconnected tools.

Software providers, platforms, investors and CFOs who align with this pragmatic view by embedding intelligent capabilities into existing OCFO workflows are best positioned to lead this transformation.

For more information, please contact us.

L.E.K. Consulting is a registered trademark of L.E.K. Consulting. All other products and brands mentioned in this document are properties of their respective owners. © 2025 L.E.K. Consultin

English
Subscribe to