Executive Insights

An Inconvenient Truth? Japan, Innovation, Drug Pricing, MFN

How U.S. most-favored-nation (MFN) pricing reshapes the Japan business case
June 12, 2026

Key takeaways

Japan represents meaningful MFN exposure, given its strategic importance to global pharma revenues and its transparent, often lower NHI prices relative to the U.S.

The exposure is real but not uniformly severe; therapy area, payer channel and product archetype will determine whether Japan meaningfully influences U.S. MFN rebate calculations 

There are reasons for cautious optimism, as GDP PPP adjustments, basket-country averaging and GLOBE/GUARD pilot caps may limit the likelihood that Japan alone becomes the binding benchmark 

Risk is likely to concentrate in oncology, immunology and chronic/metabolic categories, while rare/orphan and cell and gene therapies appear relatively more insulated

Pharma companies should act now rather than wait for policy certainty by quantifying exposure, optimizing launch sequence, maximizing Japan pricing and reassessing partnering/commercialization strategies

Japan’s exposure to U.S. MFN pricing is meaningful given its commercial importance and transparent pricing system, but the risk is more nuanced than headline price gaps imply, creating room for cautious optimism if companies quantify exposure and act early and purposefully (see Figure 1)

Figure 1

Japan and US MFN — Meaningful exposure, but reasons for cautious optimism

Image
Figure 1 Japan and US MFN — Meaningful exposure, but reasons for cautious optimism

Figure 1

Japan and US MFN — Meaningful exposure, but reasons for cautious optimism

Image
Figure 1 Japan and US MFN — Meaningful exposure, but reasons for cautious optimism

Japan has always been a paradoxical market in global pharma — and appears intuitively problematic in the context of MFN

Japan is large, important to brands and too significant to dismiss. For many innovative products, Japan represents a meaningful share of global revenue (5%-20% for top-selling drugs), matters strategically and carries weight in global launch narratives (see Figure 2). Pricing, however, is not always especially strong (see Figure 3). Sometimes it is good. Often it is acceptable. Sometimes it is low. Importantly for this discussion, it is transparent.

Figure 2

Japan brand sales as a percentage of global total

Image
Figure 2: Japan brand sales as a percentage of global total

Figure 2

Japan brand sales as a percentage of global total

Image
Figure 2: Japan brand sales as a percentage of global total

Figure 3

Japan pricing vs. other major markets 

Image
Figure 3: Japan pricing vs. other major markets

Figure 3

Japan pricing vs. other major markets 

Image
Figure 3: Japan pricing vs. other major markets

That transparency matters in a world where the U.S. is exploring MFN pricing principles.

The U.S. remains the critical market for pharmaceutical return on investment. It disproportionately funds R&D, supports group profitability, and determines whether innovative assets create significant economic value or no more than accounting profits. But U.S. pricing is also a clear outlier and can be multiples of what is paid in other major pharmaceutical markets. Executive Order 14273 of April 2025 set the MFN agenda in motion and sought to redress what many see as an unsustainable and unfair global imbalance, through ensuring U.S. patient access to lower-priced medicines, pushing overseas markets to pay more, and shifting more of the burden of drug discovery and development outside the U.S.

MFN policy implementation evolved from an initial voluntary pressure campaign that yielded 17 bilateral agreements to TrumpRx as the direct-to-consumer delivery mechanism and ultimately to three MFN pricing models (see Figure 4). Across models, the mechanism rebates U.S. prices down to international references — with the full economic impact borne by the U.S. business. In Medicaid, GENEROUS (Generating Cost Reductions for U.S. Medicaid Model) is voluntary and may give way to additional bilateral agreements. In Medicare, GLOBE (Global Benchmark for Efficient Drug Pricing Model) and GUARD (Guarding U.S. Medicare Against Rising Drug Costs Model) remain in test phase, capping rebates at the spend associated with 25% of enrollees. Full rollout seemingly would require legislation, the path for and ultimate design of which remain uncertain — though even a moderate package would reshape economics for in-scope products. Regardless, it would be imprudent for manufacturers to assume the issue will simply pass; the more durable posture is to plan for a structurally reshaped pricing landscape.

Figure 4

Overview of GENEROUS, GLOBE and GUARD models

Image
Figure 4: Overview of GENEROUS, GLOBE and GUARD models

Figure 4

Overview of GENEROUS, GLOBE and GUARD models

Image
Figure 4: Overview of GENEROUS, GLOBE and GUARD models

Japan’s pricing regime looks especially exposed; prices are unusually transparent and typically fall far below those in the U.S. The National Health Insurance (NHI) program’s prices are set through a defined rules-based methodology with formal caps on achievable premiums. Outcomes are made public, and confidential rebating between manufacturer and payer is absent. Postlaunch, the Ministry of Health, Labour and Welfare’s price survey takes about 3% off prices in an average year, though that headline figure masks considerable variation: Innovators with price maintenance premia hold up reasonably well, while post-loss of exclusivity products see materially steeper cuts. Further triggers, including market expansion repricing and cost-effectiveness analysis, push in the same direction. Recent reforms have offered some selective relief, notably the elimination of spillover repricing, but on the whole the trajectory still runs opposite to U.S. dynamics and the price gap continues to widen over the lifetime of a given drug.

What does the pharma sector’s actual Japan exposure look like?

Our analysis suggests that while manufacturer complacency is misplaced, the picture is more nuanced than headline exposure would imply. First, MFN exposure varies significantly by therapeutic area and the associated mix of U.S. payer channels. Exposure is concentrated in specialty oncology, immunology, and chronic and metabolic categories in the GUARD model, while pediatric rare and cell and gene therapies are more insulated (see Figure 5).

Figure 5

Directional MFN in-scope exposure by rebate model and drug archetype

Image
Figure 5: Directional MFN in-scope exposure by rebate model and drug archetype

Figure 5

Directional MFN in-scope exposure by rebate model and drug archetype

Image
Figure 5: Directional MFN in-scope exposure by rebate model and drug archetype

Second, Japan’s prices look problematic on an unadjusted basis, but the 1.65x GDP PPP (gross domestic product based on purchasing power parity) per capita adjustment reduces the likelihood that Japan becomes the sole benchmark (see Figure 6). Basket-country averaging under GLOBE/GUARD Method II further dampens Japan’s impact.

Figure 6

Impact of GDP PPP adjustment on Japan price differential

Image
Figure 6: Impact of GDP PPP adjustment on Japan price differential

Figure 6

Impact of GDP PPP adjustment on Japan price differential

Image
Figure 6: Impact of GDP PPP adjustment on Japan price differential

However, if Japan were to be set as the binding international benchmark, some drugs could face material U.S. MFN rebates (see Figure 7). GENEROUS would drive the deepest rebates, up to approximately 40%-80% of U.S. net price (given no 25% pilot cap), while GLOBE and GUARD are structurally softer at about 10%-25%. Rare/orphan and cell and gene therapies are relatively modest across all three. 

Figure 7

Directional estimate of MFN rebates as a percentage of US net price by drug archetype (not drug specific), with Japan prices assumed as binding international benchmark

Image
Figure 7: Directional estimate of MFN rebates as a percentage of US net price by drug archetype (not drug specific), with Japan prices assumed as binding international benchmark

MFN exposure also is not uniform across company types (see Figure 8).

Global large biopharmas face direct rebate exposure where Japan prices anchor MFN calculations, particularly on products with wide U.S.-Japan price gaps; with their scale and access infrastructure, they can delay or deprioritize Japan launches and pursue bilateral agreements as needed.

Japan-headquartered large biopharmas face full MFN rebate exposure across Japan-developed products, with limited flexibility to defer Japan launches. They may reorder global launch sequence and shift clinical lead and life cycle planning outside Japan to protect U.S. economics, although the conundrum is harder to resolve than for peers headquartered elsewhere, given social obligations to Japan.

Global emerging biopharmas have less direct exposure where Japan entry is deferred, but MFN may jeopardize planned Japan launches; some will forgo Japan altogether or reopen licensing decisions, and at minimum will seek protections in partnering agreements to safeguard the U.S. opportunity.

Japan biotech also faces challenging constraints: Japan development looks less attractive than taking intellectual property (IP) to the U.S. first, creating incentives to relocate IP and lead-asset development outside Japan — with the risk that much of the value-added is realized offshore and Japan-originated drugs never launch domestically.

Figure 8

Japan MFN implications vary materially by company archetype — Japan-HQ players face the most constrained set of responses

Image
Figure 8: Japan MFN implications vary materially by company archetype — Japan-HQ players face the most constrained set of responses

Figure 8

Japan MFN implications vary materially by company archetype — Japan-HQ players face the most constrained set of responses

Image
Figure 8: Japan MFN implications vary materially by company archetype — Japan-HQ players face the most constrained set of responses

So, what should companies do?

Companies need a practical response, with five elements running in parallel (see Figure 9):

  1. Quantify MFN exposure: Map it across products, U.S. channels and policy models; estimate drug-level rebates and Japan’s economic contribution
  2. Optimize launch sequence: Test whether Japan is the marginal binding reference, and sequence launches (e.g., high public price with confidential net pricing) to mitigate MFN drag
  3. Maximize Japan pricing: Pursue all premium pathways within NHI rules, explore foreign reference pricing adjustment within global launch sequence and limit postlaunch price compression (e.g., manage indication expansion)
  4. Advocate Japan pricing reform: Track NHI reform and bilateral trade developments, engage industry associations (e.g., Japan Pharmaceutical Manufacturers Association) and model upside under improved Japan pricing or trade-driven MFN carve-outs
  5. Reassess Japan business case and partnering agreements: Quantify Japan stand-alone net present value after accounting for MFN drag, compare “launch with rebates” versus “delay” at portfolio level, and revisit out-licensing terms (pricing outcomes, royalties, pricing control, MFN reporting access)

Figure 9

Japan MFN requires a five-part playbook — quantify, optimize, maximize, advocate and reassess

Image
Figure 9: Japan MFN requires a five-part playbook — quantify, optimize, maximize, advocate and reassess

Figure 9

Japan MFN requires a five-part playbook — quantify, optimize, maximize, advocate and reassess

Image
Figure 9: Japan MFN requires a five-part playbook — quantify, optimize, maximize, advocate and reassess

This is where L.E.K. can help

L.E.K. Consulting can help companies size their exposure, identify the products and therapeutic areas that matter most, model the U.S. and Japan profit and loss implications, and define practical response options. That includes portfolio screening, therapeutic area prioritization, company and product exposure assessment, launch and life cycle strategy, and support on pricing, market access and policy response.

Japan matters commercially, strategically and politically. The challenge now is to preserve that value while managing the risk that Japan’s price transparency erodes economics elsewhere — a balancing act that will reward those who quantify exposure, sequence launches and plan early.

L.E.K. Consulting is a registered trademark of L.E.K. Consulting LLC. All other products and brands mentioned in this document are properties of their respective owners. © 2026 L.E.K. Consulting LLC 

English
Executive Insights

US Warehouse Automation’s Next Act: A Broadening Automation Opportunity

June 12, 2026

Key takeaways

Warehouse automation is broadening beyond greenfield mega projects, with 65-70% of annual spend now tied to retrofit and brownfield upgrades across more than 20 billion square feet of existing warehouse space.

As operators face labor shortages and fulfillment complexity, automation investment is increasingly viewed as necessary operating-improvement capital focused on protecting service levels, improving efficiency and defending margins.

Midsize facilities are driving the next adoption wave, with average automation levels expected to rise through incremental workflow upgrades rather than full site upgrades.

The margin pool is shifting from hardware to intelligence as operators prioritize AI, software orchestration and warehouse execution systems that can coordinate people, equipment and decisions across interconnected systems.

Warehouse automation has historically been characterized as a greenfield arms race with a focus on bigger facilities and more robotics. This undersells the reality of the automation opportunity. For the more than 20 billion square feet of existing installed base, operators are increasingly looking to automation solutions in order to drive elevated safety, efficiency and cost savings. Warehouse automation provides a diverse set of expansion opportunities, particularly as the prevalence of smaller retrofit and brownfield projects (65%-70% of annual spend) enables new investment entry process improvement at a wide range of price points.

L.E.K. Consulting recently surveyed 200 warehouse automation decision-makers and identified a number of themes, the most pertinent being that warehouse operators are accelerating investment in automation to reduce costs and meet rising demand, with an emphasis on software, artificial intelligence (AI) and system integration (see Figure 1). Warehouse operators have been continually investing in automation solutions, with facility automation levels building up from 2022 to 2025.

Figure 1

Warehouse automation annual investment budget growth, by average facility size range in square footage (2025 comparison to 2028)

Image
Figure 1 Warehouse automation annual investment budget growth, by average facility size range in square footage (2025 comparison to 2028)

Figure 1

Warehouse automation annual investment budget growth, by average facility size range in square footage (2025 comparison to 2028)

Image
Figure 1 Warehouse automation annual investment budget growth, by average facility size range in square footage (2025 comparison to 2028)

Equally important as the growth rate is the rationale for upping investment despite uncertain macroeconomic conditions. Warehouse decision-makers view this spend as one of the few credible ways to protect service levels while defending margins and generating a fast and favorable return profile. Survey respondents indicate they have realized an approximately 20%-40% return on investment (ROI) across warehouse automation investments. This combination is shifting the spend narrative from large discretionary projects to necessary improvements meant to drive return and differentiation.

Midsize facilities are driving warehouse automation demand

Warehouse operators are facing business challenges due to labor shortages, escalating complexity and fulfillment speed requirements, necessitating investments in solutions that reduce operating costs, improve throughput/processing speed and enhance accuracy/reduce errors. Fortunately, modest investments are able to deliver tangible benefits for operators. Warehouses span a spectrum of automation levels, from fully manual (Level 0) to fully automated systems (Level 4) (see Figure 2). Incremental automation investments drive movement to higher-level scores as the role of manual processes is reduced.

Figure 2

Levels of warehouse automation

Image
Figure 2 Levels of warehouse automation

Figure 2

Levels of warehouse automation

Image
Figure 2 Levels of warehouse automation

Investment is causing facility automation levels to gradually rise. There is significant runway for further adoption, as average facility automation is expected to move from 2.04 (out of 4) in 2025 to 2.41 in 2028, enhancing the degree of mechanized support found in each building (see Figure 3). The market is upgrading gradually by expanding the role of technology in critical workflows, rather than rapidly shifting to Level 4 automation. That is why the opportunity is durable: After one workflow is upgraded, companies look to find the next area to upgrade. The installed base is large, under-automated and expensive to replace outright; therefore, operators are spending to make existing networks more productive before they reinvent them.

Figure 3

Average warehouse automation level, by average facility size range in square footage (2022, 2025, 2028)

Image
Figure 3 Average warehouse automation level, by average facility size range in square footage (2022, 2025, 2028)

Figure 3

Average warehouse automation level, by average facility size range in square footage (2022, 2025, 2028)

Image
Figure 3 Average warehouse automation level, by average facility size range in square footage (2022, 2025, 2028)

Facility automation levels are concentrated at midsize buildings (100,000 to 1 million square feet) rather than at the extreme ends. This signals that future investment is not concentrated in fully manual laggards or already highly automated flagship nodes; instead, it sits in the broad middle of the market, where operators already have some mechanization but now need better orchestration, better labor leverage and better asset utilization. While organizations with average facility sizes of 1 million+ square feet anticipate the most meaningful growth in warehouse automation budgets, the adoption wave is expected to expand over time, with smaller and midsize facilities still expecting significant gains in automation levels by 2028. That is a particularly favorable demand pattern: Large-node projects anchor near-term spend while the long tail gradually opens as modular solutions and software reduce deployment friction.

Software, AI and orchestration are the most important value layer

Many warehouses have made initial inroads into equipment that helps drive process speed and efficiency, which is now driving a wave of investment around extracting more performance from existing equipment. One key investment lever for driving incremental value is automation software, which is ranked by facility operators as the single highest priority for future investment (see Figure 4).

Figure 4

Warehouse automation software investment themes

Image
Figure 4 Warehouse automation software investment themes

Figure 4

Warehouse automation software investment themes

Image
Figure 4 Warehouse automation software investment themes

Warehouse execution systems (WES) are becoming more sophisticated, featuring better interface and integration with warehouse management system layers as multisystem warehouses become harder to manage through rules-based control alone. AI is increasingly part of the same story, with nearly half of operators rating it as highly important to warehouse automation investment. The primary use cases for AI in this context are centered on forecasting, knowledge support, warehouse planning and demand prediction.

As the warehouse automation space evolves, investment is not moving away from hardware. Instead, it is moving toward the orchestration layer, which makes existing hardware more productive and selectively pulls through additional robotics. With operators moving from isolated automation purchases to interconnected systems, value migrates toward the layer that can coordinate people, equipment and decisions in real time. Consequently, in warehouse automation, a growing margin pool is expected to sit less in the most visible machine and more in the intelligence wrapped around it.

Integrators play a central role in ROI delivery

As warehouse automation investment grows in complexity, system integrators have emerged as the primary purchase channel, providing the expertise across hardware and software that drives measurable returns. Rather than purchasing discrete components, operators increasingly seek end-to-end solutions tailored to the physical and operational realities of their facilities, with integrators helping navigate trade-offs between near-term disruption and long-term efficiency gains.

Effective integrators are shifting from hardware-led integration to software-driven orchestration to drive service differentiation and margin, placing added focus on the ability to develop or access complementary technology capabilities. When done well, the results are compelling: More than 80% of warehouse operators report automation payback periods under two years, with approximately 20%-40% ROI driven by labor savings, throughput gains, damage reduction and lower operating costs. As a result, integrator use is expected to expand, making it one of several durable, high-value entry points for automation investors.

Warehouse automation offers diverse value creation opportunities

U.S. warehouse automation is growing and increasingly has multiple vectors for investment. Operators are not only turning toward new scaled facility build-out but also prioritizing brownfield modernization, software-led orchestration and high-ROI upgrades inside the installed base. They are concentrating their efforts first on large throughput-critical nodes, then expanding into smaller facilities as technologies become easier to deploy. And they are favoring the partner that can make heterogeneous systems work together reliably. In a market still early in its penetration curve, structural growth and favorable value capture are beginning to converge.

At L.E.K., we support warehouse automation stakeholders across the value chain as they navigate their most pressing challenges. Our experts bring proprietary perspectives on investable opportunities and operational due diligence, identifying stress points and inefficiencies in existing models in order to deliver tangible cost savings and productivity improvements.

Please contact us for more information.

L.E.K. Consulting is a registered trademark of L.E.K. Consulting LLC. All other products and brands mentioned in this document are properties of their respective owners. © 2026 L.E.K. Consulting LLC

English

Key takeaways

The top 15 biopharma companies face an estimated $210 billion growth gap by 2032 relative to historical growth trajectories.

Most companies are concentrating investment in the same therapeutic areas, intensifying competition and crowding late-stage pipelines.

Closing the gap through a higher volume of “average” blockbuster launches is unlikely to be economically or operationally viable; as a result, transformational assets — products that generate more than $5 billion in annual sales — remain the strongest path to sustained growth.

Success will require a step change in portfolio strategy, resource allocation and organizational agility to create and scale the transformational assets needed to close the growth gap.

A $210 billion problem

Large biopharma companies face a significant growth challenge over the coming decade. Based on independent analyst forecasts, the combined portfolios of the top 15 biopharma companies¹ are expected to generate approximately $430 billion of sales growth through 2032 from in-line product growth and new launches. Offset by $230 billion in loss of exclusivity and sales declines from in-line products, the net $200 billion growth equates to an approximately 3% compound annual growth rate.

By contrast, most companies continue to guide toward mid-to-high-single-digit growth, broadly in line with the sector’s historical roughly 6% annual growth trajectory. Sustaining that growth rate through 2032 would therefore require materially more growth than current portfolios are projected to deliver, implying an estimated growth shortfall of approximately $210 billion (see Figure 1).²

Figure 1

Gap between projected top 15 biopharma sales growth and historical growth rates (2025-32F)

Image
Figure 1 Gap between projected top 15 biopharma sales growth and historical growth rates (2025-32F)

Figure 1

Gap between projected top 15 biopharma sales growth and historical growth rates (2025-32F)

Image
Figure 1 Gap between projected top 15 biopharma sales growth and historical growth rates (2025-32F)

The magnitude and timing of the challenge vary across companies, but the issue is broad-based. Relative to a 6% growth target, 14 of the 15 companies face a median sales gap of roughly $13 billion. While some companies face more immediate pressure than others, the overall picture points to a sectorwide need to rethink how growth is generated.

The economics of thinking bigger

There are, in essence, only two ways to close a growth gap of this magnitude: Launch more assets or launch bigger ones. Bridging a $13 billion shortfall with $1 billion to $2 billion worth of products would require seven to 13 commercial successes, each with its own R&D investment, regulatory pathway, launch infrastructure and life-cycle management requirements. In practice, that level of parallel activity could strain capital allocation, dilute leadership focus and materially increase organizational complexity and execution risk.

The historical record strongly favors scale. Between 2015 and 2025, nearly 50% of revenue growth for large biopharma companies came from products generating more than $5 billion in annual sales, with products exceeding $10 billion accounting for nearly one-third of total growth.³ These assets have consistently delivered disproportionate value through broad indications, strong clinical differentiation and global commercial reach — dynamics that are likely to become even more important over the next decade.

Transformational assets also create structural economic advantages. In 2025, the four highest-margin pharma companies derived approximately 40%-60% of revenue from a single scaled product, underscoring the operating leverage associated with these franchises.⁴

Beyond direct scale benefits, scaled franchises often create spillover advantages across adjacent products by leveraging shared commercial infrastructure, physician relationships, payer access and therapeutic expertise. Looking ahead, the contribution from scaled assets remains a powerful engine of growth. Twenty transformational assets are projected to drive roughly 30% of growth, approximately $135 billion of the $430 billion in combined in-line and new-product sales expansion expected across the top 15 biopharma companies through 2032 (see Figure 2).

Yet this figure is likely understated by headline projections, which may not fully reflect the long-term contribution of many of these transformational assets. A number remain in active label expansions that could meaningfully broaden addressable markets. Equally, several of these assets show no signs of plateauing by 2032, with growth trajectories poised to extend well into the following decade.

Figure 2

$430 billion 2025-32F growth pool distribution by 2032F asset sales

Image
Figure 2 $430 billion 2025-32F growth pool distribution by 2032F asset sales

Figure 2

$430 billion 2025-32F growth pool distribution by 2032F asset sales

Image
Figure 2 $430 billion 2025-32F growth pool distribution by 2032F asset sales

A more crowded competitive landscape

Five areas — oncology, endocrinology/obesity, immunology, central nervous system and anti-infectives — account for approximately 80% of the $430 billion in projected in-line and new-product growth through 2032 (see Figure 3). This concentration in a narrow set of high-value markets is intensifying competition, accelerating crowding and raising the bar for differentiation.

Figure 3

$430 billion 2025-32F growth pool distribution by therapeutic area

Image
Figure 3 $430 billion 2025-32F growth pool distribution by therapeutic area

Figure 3

$430 billion 2025-32F growth pool distribution by therapeutic area

Image
Figure 3 $430 billion 2025-32F growth pool distribution by therapeutic area

The same dynamic is visible at the disease area (DA) level. Although the typical large pharma company has active late-stage programs across 25-35 DAs, roughly 70% of those programs compete in areas where at least three other large pharma companies also have active late-stage programs. Pipeline breadth alone has therefore not created meaningful differentiation; many companies are effectively investing behind the same opportunities.

In this environment, simply “thinking big” is not enough. Future growth will depend on identifying opportunities where companies can build a distinctive advantage before the rest of the market converges.

Enabling transformational innovation

Transformational assets are exceptionally rare: Just 3% of products on the market today generate more than $5 billion in annual sales. The challenge for biopharma companies is therefore not simply to innovate but also to maximize the probability of producing these outsize assets. Three principles stand out.

1. Develop portfolios around scaled outcomes

The objective of portfolio strategy should not be maximizing pipeline volume, but maximizing the number of credible transformational asset “shots on goal” on a risk-adjusted basis.

A critical starting point is establishing a disciplined framework for identifying and exiting subscale assets. Too often, organizations continue advancing programs with limited commercial potential because portfolio termination decisions are organizationally difficult. As a result, capital, scientific talent and management attention become tied up in assets unlikely to generate meaningful long-term value creation. Over time, this dynamic can materially reduce organizational agility and limit the ability to pursue more promising opportunities.

To fill their growth gaps, large biopharma companies must differentiate themselves through rigorous portfolio optimization processes that continuously assess strategic fit, commercial potential and probability of success across the pipeline. Rather than spreading resources thinly across a broad set of marginal programs, these organizations make deliberate decisions to prioritize high-conviction opportunities early. They actively reallocate investment, talent and operational support toward assets with the potential to become transformative growth drivers while decisively deprioritizing lower-potential programs. This sharper focus not only improves capital efficiency but also increases the likelihood of accelerating innovation and maximizing long-term portfolio value.

At the same time, companies need a realistic assessment of whether their core DAs and therapeutic areas can support the scale of growth required. If the portfolio cannot produce a sufficient number of credible transformational opportunities within existing areas of focus, expansion into adjacent areas may become necessary.

To date, the historical pattern has been one of concentration in the core rather than expansion beyond it. Of the 20 transformational assets expected to drive sales growth for the top 15 biopharma companies by 2032, 13 assets launched in core DAs where the company already had an established footprint at launch, accounting for nearly 80% of the projected $135 billion in sales growth. Five were adjacent, in a new disease indication within an existing therapeutic franchise, and only two were in true white space, defined as a therapeutic area with little to no company experience (see Figure 4).

Figure 4

$135 billion transformational asset 2025-32F growth pool, by core vs. adjacent vs. white space status

Image
Figure 4 $135 billion transformational asset 2025-32F growth pool, by core vs. adjacent vs. white space status

Figure 4

$135 billion transformational asset 2025-32F growth pool, by core vs. adjacent vs. white space status

Image
Figure 4 $135 billion transformational asset 2025-32F growth pool, by core vs. adjacent vs. white space status

This concentration reflects the compounding advantages of building from the core: established science, mature commercial infrastructure, deep physician relationships and hard-won payer access. Yet there is a natural ceiling to how far such concentration can be extended. Success in any therapeutic or disease area inevitably attracts new entrants, intensifying competition and gradually eroding the differentiation that made the core attractive in the first place. The strategic implication is a dual imperative: Companies must continue to mine and defend their core franchises while simultaneously laying the scientific and commercial foundations to extend into adjacent disease and therapeutic areas. Those that manage this balance effectively will be best positioned to generate above-market growth across the decade.

2. Build leadership in novel therapeutic paradigms

Even a disciplined core-and-adjacent strategy has limits when the underlying science matures. In categories where dominant mechanisms are well understood and standards of care are largely set, incremental innovation often does not produce transformational economics, and later entrants often compete on the margins.

The industry’s most transformational assets have not always emerged from its most active markets. The assets are often the product of scientific frontiers and DAs the broader industry had yet to fully appreciate — developed by companies willing to enter DAs ahead of the field or those where breakthrough innovation had stalled, and in some cases these companies reimagined the commercial model entirely. For example, Novo Nordisk invested heavily in obesity biology years before GLP-1 therapies evolved into one of the industry’s largest commercial categories. Similarly, Regeneron and Sanofi expanded the Dupixent franchise across multiple type 2 inflammatory diseases by leveraging a shared underlying biological pathway and overlapping physician call points.

These companies do not simply follow the science; they shape it. By assuming early risk in areas of compelling biology and significant unmet need, they define standards of care and establish category leadership years before competitors can meaningfully respond — converting first-mover advantage into a structural position that followers can spend years trying to close.
The implication is clear: Disproportionate long-term returns require more than optimizing the existing portfolio. They require selective, courageous bets on novel therapeutic paradigms placed early enough to shape the market, not just participate in it.

3. Align capital and organization behind conviction

Portfolio strategy creates the conditions for success, but conviction determines whether breakout opportunities ultimately realize their potential. In large pharmaceutical organizations, transformative assets rarely advance on data alone; they require senior leaders willing to champion them before the evidence is fully established and sustain support through scientific uncertainty, development setbacks and competing portfolio pressures.

This challenge is especially acute for opportunities outside the company’s historical core. Leaders are often forced to choose between a higher-risk asset with transformative potential and lower-risk smaller investments with more predictable outcomes. Capturing breakout opportunities therefore requires a willingness to make and sustain difficult trade-offs over multiple years.
When a genuine breakout opportunity emerges, investment levels must match the scale of the ambition rather than the asset’s stage of development. That often means allocating disproportionate resources, accelerating capability building and deprioritizing other parts of the portfolio to create room. Companies that apply standard resource-allocation approaches to exceptional opportunities frequently constrain their upside before the opportunity has fully developed.

The ability to reposition early as science evolves is equally important. Merck’s transformation around Keytruda illustrates the point. In 2011, oncology represented less than 3% of company revenue⁶ and Keytruda had no late-stage trials. Within five years, however, the asset accounted for 40% of Merck’s phase 2 and 3 trials.⁷ Achieving that shift required far more than reallocating capital; it required building new capabilities, making explicit trade-offs across the portfolio and sustaining organizational commitment years before the commercial opportunity was fully validated.

Beyond the portfolio

For large biopharma companies facing a widening growth gap, the challenge is not simply one of portfolio composition. While getting the portfolio “geometry” right is an important first step, sustaining growth in a dynamic market also requires an operating model capable of reallocating resources toward emerging opportunities and away from subscale assets and increasingly exhausted areas of science. Underpinning both is a culture willing to tolerate risk, back conviction over consensus and support breakout opportunities through uncertainty.

Executing this shift is inherently difficult within large pharmaceutical organizations, where entrenched processes, budgeting cycles and competing stakeholder priorities often reinforce the status quo. Meaningful change therefore requires sustained sponsorship from the C-suite, not only to reshape the portfolio but also to rethink how capital, talent and organizational attention are allocated across the business.

The companies best positioned to capture the next generation of transformational assets are unlikely to be those with the broadest pipelines, but those most capable of concentrating resources behind a small number of differentiated opportunities and adapting as the science evolves. In an increasingly crowded industry, competitive advantage will come less from participating in the same high-growth categories as peers and more from identifying and scaling emerging opportunities earlier than the rest of the market.

For more information, please contact us.

The authors would like to thank Izzy Wilson for her contributions to this article.

Note: AI was used in the drafting of this piece

Endnotes
¹Based on 2025 total prescription sales excluding generics and biosimilars
²L.E.K. analysis of EvaluateGroup
³L.E.K. analysis of EvaluateGroup
⁴L.E.K. analysis of S&P Capital IQ and EvaluateGroup 
⁵L.E.K. analysis of company-disclosed 2026 pipelines 
⁶L.E.K. analysis of EvaluateGroup
⁷L.E.K. analysis of clinicaltrials.gov

L.E.K. Consulting is a registered trademark of L.E.K. Consulting LLC. All other products and brands mentioned in this document are properties of their respective owners. © 2026 L.E.K. Consulting LLC

English
Executive Insights

AI in Healthcare IT: Opportunities, Threats and the New Build-vs-Buy Equation

June 10, 2026

Key takeaways

Artificial intelligence (AI) is shifting healthcare information technology (HCIT) value from feature development to governed workflow execution as coding speed becomes less defensible and integration, compliance and trust become more important.

Systems of record remain protected in the near term, but most AI value will accrue in adjacent workflow, insight, engagement and innovation layers.

HCIT companies can expand addressable markets through AI-enabled modules and orchestration layers but will require new pricing models as per-seat economics come under pressure.

Provider self-build is becoming a credible and accelerating threat, particularly where scaled healthcare organisations can build differentiated workflow, engagement and AI capabilities.

Winning vendors will move from closed systems of record to open, regulated, AI-native platforms, combining extensibility, governance, orchestration and outcome-linked commercial models.

AI is reshaping the economics of healthcare software

The past two years have shifted the healthcare technology debate from whether artificial intelligence (AI) can create value to where it can be adopted safely, profitably and at scale. Generative AI (GenAI) is already moving from content generation to workflow assistance, while the next wave of agentic AI promises cross-system task execution: scheduling, routing, documentation, order management, coding, reporting and decision support. The industry is moving from AI-enabled productivity tools towards governed workflow orchestration, with value increasingly concentrated in integration, governance and execution layers (see Figure 1).

This shift matters profoundly for healthcare information technology (HCIT) companies. Historically, software vendors have benefited from product complexity, scarce engineering capacity and the difficulty of building reliable applications for regulated healthcare environments. AI-assisted software development and ‘vibe coding’ are weakening some of these barriers by making software cheaper and faster to build. Larger healthcare services providers, particularly those with scale, proprietary data assets and specialised workflows, are now asking whether they should build more of their own solutions.

However, the conclusion should not be that HCIT moats are disappearing. Instead, they are moving. Coding speed, rapid prototypes and feature-level differentiation are commoditising. The more durable sources of advantage are healthcare specific: reliability, regulatory-grade governance, integration depth, data access, change management, evidence, implementation capacity and embedded distribution through systems of record.

Figure 1

AI value in healthcare IT is shifting from content generation to governed workflow execution

Image
Figure 1: AI value in healthcare IT is shifting from content generation to governed workflow execution

Figure 1

AI value in healthcare IT is shifting from content generation to governed workflow execution

Image
Figure 1: AI value in healthcare IT is shifting from content generation to governed workflow execution

AI is reshaping software economics

AI is changing both the supply and demand sides of healthcare software. On the supply side, coding, testing, documentation and design workflows can now be accelerated materially by AI tools. Software companies can release more functionality with the same development resources; at the same time, customers with strong internal product owners and clinical experts can build more bespoke tools than before.

On the demand side, buyers are becoming less impressed by demos and more focused on proof. If many vendors can produce a plausible workflow mock-up, the real questions become whether the software is validated, integrated, governed, secure and capable of performing reliably in a local care environment. Healthcare buyers will increasingly ask for evidence of productivity, throughput, safety, data quality and compliance rather than for a simple features list.

This creates an apparent paradox. AI lowers the cost of building software, which threatens established vendors. But healthcare-grade deployment remains difficult, which protects vendors that have already industrialised quality management, validation, interoperability, cybersecurity and customer support.

Implications for HCIT executives 

The primary strategic risk is not feature replication alone but also erosion of control over the workflow layer as customers, hyperscalers and AI-native entrants converge on the same operational domains. The response should be to accelerate development, modernise architecture and reprice value around measurable outcomes while making the regulated core harder to displace.

Why systems of record remain protected

In HCIT, systems of record remain the anchor of value capture. Electronic medical record (EMR), radiology information system/picture archiving and communication system and laboratory information system platforms are mission-critical operational systems. They are deeply embedded into clinical workflows, billing logic, regulatory reporting, data access and daily operations. Replacement cycles can extend five to 10 years or more, and migrations are risky, expensive and operationally disruptive.

For this reason, near-term AI value is likely to concentrate in modules adjacent to the core rather than in full replacement of the core. Systems of engagement, action, insight and innovation can move faster because they add functionality around the existing stack. But they still need access to the data and workflows controlled by systems of record. This makes incumbent HCIT vendors gatekeepers: third-party AI can scale only when it is integrated into the clinical and operational pathways.

Near-term AI value is likely to concentrate in systems of action, insight and engagement rather than in the wholesale replacement of systems of record (see Figure 2).

The core systems are protected by six reinforcing moats:

  1. Reliability and uptime: Downtime disrupts patient care, billing and clinician trust, making risk mitigation a central procurement criterion.
  2. Interoperability: Buyers require dependable connections to adjacent clinical, diagnostic, financial and national eHealth systems.
  3. Workflow embedding: Local clinical variation, training, adoption and change management increase switching costs.
  4. Regulatory-grade governance: Medical Devices Regulation (MDR), US Food and Drug Administration, EU AI Act, General Data Protection Regulation, Health Insurance Portability and Accountability Act and quality-system requirements create documentation and monitoring burdens that favour mature vendors.
  5. Evidence and track record: Buyers prefer proven solutions with similar integrations and clear outcomes, particularly in mission-critical environments.
  6. Distribution and installed base: The vendor that owns the system of record has privileged access to users, data, workflows and procurement conversations.

Figure 2

AI value will concentrate around systems of record rather than replace them in the near term

Image
Figure 2. AI value will concentrate around systems of record rather than replace them in the near term

Figure 2

AI value will concentrate around systems of record rather than replace them in the near term

Image
Figure 2. AI value will concentrate around systems of record rather than replace them in the near term

The strategic consequence is that HCIT vendors should not defend only the database or the transaction system — they should defend the integration point. Vendors that become the orchestration layer for AI workflows can capture value even when the underlying algorithm is built by a partner, marketplace participant or customer.

Where AI value will scale first

AI adoption scales fastest where return on investment is immediate, accountability is clear and the workflow is bounded. Administrative productivity, documentation, coding, scheduling, triage, quality control and reporting are likely to scale more quickly than open-ended clinical autonomy. These areas have measurable labour impact, lower clinical risk and clearer ownership within provider organisations.

Clinical AI will continue to develop, particularly in imaging and other data-rich areas, but broader autonomy remains constrained by fragmented data, local workflow variation, validation requirements, liability ambiguity and regulatory change control. Only a limited number of fully or partially autonomous solutions have achieved clearance, and most approved tools still support rather than replace clinicians.

The opportunity for HCIT companies is significant. AI modules can expand the addressable market beyond the traditional core system: AI receptionists, scribes, revenue cycle automation, capacity management, reporting optimisation, diagnostic AI marketplaces, data services and governance tools can all become paid add-ons. In outpatient and diagnostic settings, the AI-enabled module opportunity may approach or exceed the value of the original software subscription in selected use cases.

However, the pricing model must evolve. Per-seat and per-site pricing can be exposed when AI reduces staff requirements or shifts work to automated agents. Vendors should consider usage, transaction, throughput, outcome, shared savings or hybrid pricing models that align with the value created.

The provider build threat is real — but selective

The build-versus-buy equation for healthcare services providers is changing. AI-assisted development, low-code environments, modular architectures and open-source models are making it easier for scaled providers to build workflow applications, analytics layers and specialised patient-facing tools. Large providers are also accumulating proprietary data that can be used to train or tailor AI systems.

European providers have already demonstrated that self-build is no longer limited to a small group of academic pioneers. Examples span in-house EMRs, telehealth platforms, patient portals, analytics layers and medical AI tools. Provider self-build activity has accelerated significantly since the GenAI inflection, particularly in workflow, engagement and AI layers, where differentiation matters most (see Figure 3).

Figure 3

European provider self-build activity is accelerating as GenAI lowers workflow and AI development barriers

Image
Figure 3. European provider self-build activity is accelerating as GenAI lowers workflow and AI development barriers

Figure 3

European provider self-build activity is accelerating as GenAI lowers workflow and AI development barriers

Image
Figure 3. European provider self-build activity is accelerating as GenAI lowers workflow and AI development barriers

Most providers are unlikely to build across the entire stack. Instead, a hybrid architecture is emerging: build where workflow differentiation matters and buy where regulation, interoperability, cybersecurity and compliance dominate. Build-versus-buy preferences vary materially by provider archetype and stack layer (see Figure 4).

Notably, internally developed systems deployed within a single legal entity may benefit from reduced MDR obligations in some use cases, further increasing the attractiveness of selective self-build strategies for scaled providers.

Figure 4

Provider build-versus-buy preferences vary materially by provider archetype and stack layer

Image
Figure 4: Provider build-versus-buy preferences vary materially by provider archetype and stack layer

Figure 4

Provider build-versus-buy preferences vary materially by provider archetype and stack layer

Image
Figure 4: Provider build-versus-buy preferences vary materially by provider archetype and stack layer

How HCIT companies should respond

The build threat should not lead HCIT companies to defend closed systems at all costs. In many markets, the closed-system posture will become less attractive as clients seek to experiment with AI, build micro apps and deploy models on top of their existing data and workflow infrastructure. The defensive end state for many HCIT vendors is likely to be an open, regulated, AI-native platform rather than a fully closed system architecture (see Figure 5). Five strategic moves are particularly important:

  1. Create a platform and extensibility layer: Offer application programming interfaces (APIs), software development kits, sandboxes, low-code/no-code tooling and curated marketplaces so providers build on the vendor platform rather than around it.
  2. Become a regulatory utility: Turn national eHealth connectors, AI governance, cybersecurity, audit trails, documentation, validation and post-market monitoring into productised capabilities.
  3. Build agentic-native architecture: Enable model-agnostic tool calling, role-based permissions, human-in-the-loop controls, full logs and workflow-specific guardrails.
  4. Deepen vertical workflow fit: Use specialty modules, outcome benchmarks and clinical workflow content to preserve differentiation where generic AI tooling is weakest.
  5. Reset commercial models: Move towards usage, transaction, outcome or co-development economics where AI changes the link between seats, work and value.

Figure 5

Healthcare IT vendors are shifting from closed systems of record to open, regulated, AI-native platforms

Image
Figure 5: Healthcare IT vendors are shifting from closed systems of record to open, regulated, AI-native platforms

Figure 5

Healthcare IT vendors are shifting from closed systems of record to open, regulated, AI-native platforms

Image
Figure 5: Healthcare IT vendors are shifting from closed systems of record to open, regulated, AI-native platforms
Strategic warning

The vendors most exposed are those that treat AI as a feature add-on while leaving architecture, pricing, implementation and governance unchanged. The winners will use AI to redesign the product operating model, the customer development model and the commercial model simultaneously. 

Suggested graphic source: AI deck slides 13 and 15; HCS deck slide 5

Implications for investors and boards

For investors, the central diligence question is shifting from “Does the company have AI features?” to “Does the company have the right to win in an AI-enabled, hybrid build-versus-buy world?” That right to win should be tested across both defence and offence.

On defence, investors should assess which product modules are easiest for customers or new entrants to replicate, where the system is protected by regulatory or integration barriers, and whether pricing is exposed to AI-driven productivity gains. On offence, they should assess the vendor’s ability to capture a new module technology acceptance model (TAM), become the AI marketplace or orchestration layer, monetise data services and support client-side innovation without losing control of the platform. The strongest HCIT assets are likely to combine mission-critical installed bases with modern integration architecture, credible AI governance, strong customer support, specialty workflow depth and a clear roadmap towards higher levels of automation. This combination is likely to command a premium, while closed, slow-moving products with weak APIs and limited AI readiness may face increasing multiple pressure.

HCIT moats are shifting, not disappearing

AI will not replace HCIT systems of record overnight. The healthcare environment remains too regulated, fragmented, risk-sensitive and workflow-specific for a rapid displacement cycle. However, AI will change where value is created and captured. The edge of the stack will move faster; the core will remain protected but must become more open, more intelligent and more extensible.

For HCIT companies, the opportunity is to convert the threat into a platform strategy. By enabling customers to innovate on top of trusted systems, vendors can retain the system-of-record moat while expanding into AI workflow modules, marketplaces, data services and governance. By resisting openness, they risk encouraging customers to build around them.

For larger healthcare services providers, the rational answer will increasingly be hybrid: build the differentiating workflow and AI layer, buy the regulated plumbing and integrate both around a stable system of record. The winners on both sides will be those that understand that AI has not eliminated healthcare software moats; it has redefined them.

How L.E.K. Consulting can help

L.E.K. helps HCIT companies, healthcare services providers and investors assess how AI changes product strategy, competitive advantage, build-versus-buy decisions and value creation. Our work spans AI opportunity assessment, product and platform strategy, commercial model redesign, healthcare data strategy, regulatory and interoperability roadmaps, and investor diligence.

For HCIT companies, this includes identifying AI-driven TAM expansion, mapping build-risk exposure by module and customer segment, designing AI-native platform strategies and developing a prioritised autonomy roadmap. For healthcare services providers, it includes determining which workflow and AI capabilities should be built, bought or partnered and how to do so without compromising compliance, safety or implementation speed.

To discuss how AI could reshape your healthcare technology strategy, platform roadmap or build-versus-buy decisions, contact us.

L.E.K. Consulting is a registered trademark of L.E.K. Consulting. All other products and brands mentioned in this document are properties of their respective owners. © 2026 L.E.K. Consulting

English

Why Channel Strategy Is Becoming the Defining Value Lever in Spanish Dermocosmetics

June 10, 2026

The Spanish dermocosmetics market continues to attract strong investor interest, supported by resilient category growth, premium positioning and favourable consumer trends. Yet many evaluation frameworks still underemphasise one of the most important drivers of long-term value creation: channel positioning.

While brands increasingly operate across multiple routes to market, channel strategy remains central to competitive advantage, shaping pricing discipline, consumer trust, recommendation dynamics and margin resilience. As the market becomes more crowded and omnichannel expansion accelerates, the ability to manage channel architecture effectively is emerging as a critical differentiator between high-quality assets and average transactions.

The Spanish skincare market grew at approximately 7% annually between 2022 and 2025, outpacing the broader beauty and personal care sector, and is forecast to sustain c.4%-5% annual growth through 2030. Ecommerce remains the fastest-growing channel at c.12% annually, while pharmacies continue to represent c.15%-20% of the market, reflecting their enduring role in recommendation-led purchasing.

Three developments are reshaping competitive dynamics across the category.

First, the “skincare as healthcare” trend has broadened the consumer base well beyond traditional pharmacy shoppers. Younger consumers are entering the category through digital channels with high ingredient literacy and strong exposure to influencer-led discovery.

Second, the competitive landscape has become increasingly fragmented. Pharmacy shelves once dominated by a limited number of established brands now face competition from a growing number of credible local and international players.

Third, and most importantly for investors, channel conflict has become a defining strategic challenge. Brands that expanded distribution without preserving pricing discipline or channel differentiation have, in some cases, weakened pharmacist recommendation rates and undermined brand credibility.

Channel positioning shapes long-term value

Many investors continue to prioritise brand equity over the economics of the channels through which that equity is monetised. However, channel architecture increasingly determines the sustainability of growth, pricing power and competitive defensibility.

Four broad archetypes continue to define the Spanish dermocosmetics landscape. While the boundaries between them are becoming less distinct, each structural characteristic is rooted in its original channel strategy (see Figure 1).

Image
Figure 1: Dermocosmetics channel archetypes
Image
Figure 1: Dermocosmetics channel archetypes

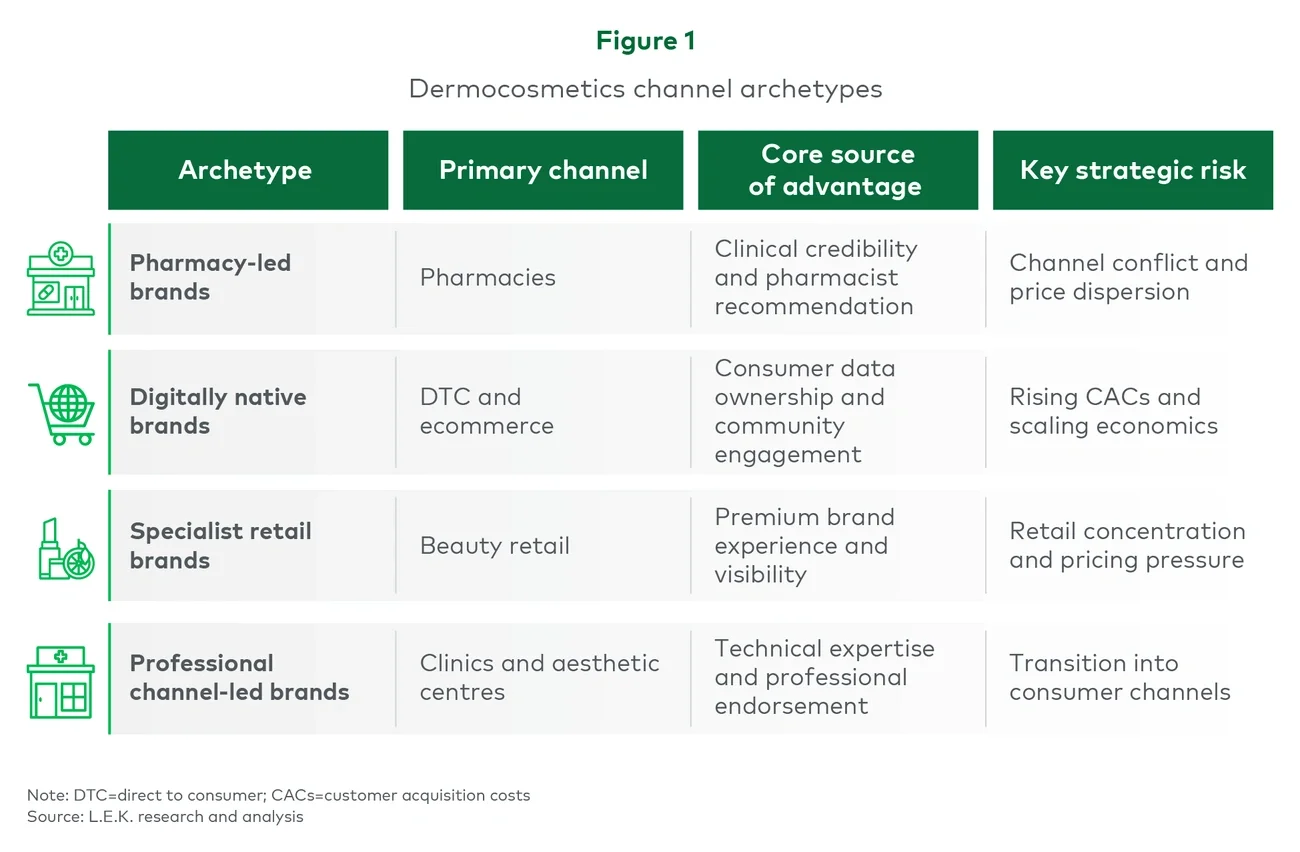
Pharmacy-led brands: Strong equity built on trust and execution

Brands such as ISDIN, Cantabria Labs and Sesderma have historically built their position through pharmacies, where recommendations and credibility remain critical drivers of purchases.

Their competitive advantage rests on clinical positioning, dermatologist endorsement and long-term pharmacist relationships supported through training, point-of-sale activation and product education. These factors create meaningful barriers to displacement when executed effectively.

ISDIN demonstrates the strength of this model through disciplined channel management, including differentiated product ranges, limited price dispersion across channels and pharmacy exclusivity periods for selected launches. Cantabria Labs has similarly maintained strong positioning through focused pharmacy execution and dermatologist endorsement.

The risks emerge when channel discipline weakens. Selling identical stock keeping units across pharmacies, retail, marketplaces and direct-to-consumer (DTC) channels without differentiation can create pricing pressure and undermine pharmacist confidence. Brands with significant price dispersion across channels often experience deterioration in recommendation dynamics that can take years to rebuild.

For investors, pharmacy-led brands with strong channel discipline continue to command premium valuations because their scientific authority can support expansion into adjacent channels and geographies. However, brands facing channel conflict and inconsistent commercial execution warrant greater caution.

Digitally native brands: High growth with scalability questions

Digitally native brands such as Freshly, The Niche Beauty Lab, Coconut and Lico built their initial consumer base through social media, DTC channels and digitally led engagement strategies.

Their proposition typically combines ingredient transparency, accessible pricing and strong community engagement. Operationally, these brands often benefit from a sophisticated understanding of customer behaviour, cohort economics and direct consumer engagement.

The investment appeal is clear: rapid growth, consumer data ownership and relatively asset-light infrastructure. However, international experience from the UK and US beauty markets has demonstrated that customer acquisition costs often rise materially as brands scale. Growth models driven initially by organic acquisition can become significantly more challenging once paid acquisition becomes the primary growth engine.

The key strategic question is whether digitally native Spanish brands can transition successfully into broader omnichannel distribution without diluting the positioning that supported early growth. Entering the wrong channel too early can alter consumer perception and compress pricing.

Investors therefore need to assess not only current growth rates but also the sustainability of customer acquisition economics and the credibility of the brand’s broader channel expansion strategy.

Specialist retail brands: Growing opportunity with active management requirements

Brands operating through specialist beauty retail channels such as Druni, Primor, Sephora and El Corte Inglés continue to benefit from increasing consumer interest in premium skincare.

However, the Spanish specialist retail market remains relatively concentrated, with negotiating leverage sitting among a limited number of major accounts. In addition, dermocosmetics penetration within specialist retail remains lower than in more developed European markets.

Despite these constraints, the channel continues to offer an attractive route for brands capable of maintaining a differentiated premium positioning. Several brands have navigated this successfully by preserving a clear consumer proposition while avoiding excessive distribution expansion.

Professional channel-led brands: Clinical authority with expansion potential

Brands such as Mesoestetic, HBA and Germaine de Capuccini originated within clinics and professional treatment environments, where technical expertise and practitioner endorsement underpin brand credibility.

These businesses are increasingly extending across the consumer journey through pre- and post-treatment product ranges, often supported by ecommerce platforms, owned clinics or expansion into adjacent retail channels.

The opportunity is significant, but execution remains critical. Consumer-facing formulations must preserve the efficacy narrative associated with the professional channel, while expansion into pharmacy or specialist retail requires commercial capabilities that many professional-channel businesses historically did not need to develop.

For investors, the central question is whether these brands can broaden their consumer presence without weakening the professional endorsement that originally differentiated them.

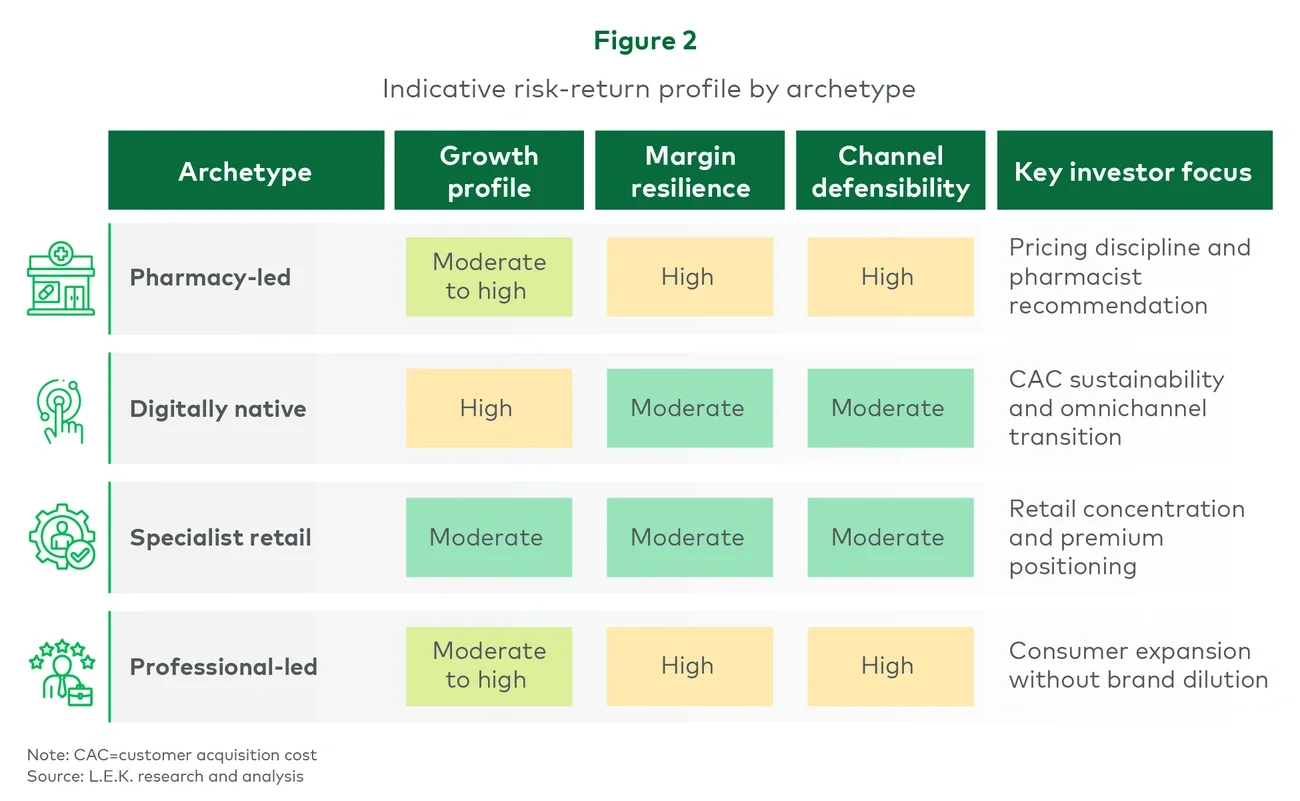
These structural differences translate into materially different growth, margin and defensibility profiles across archetypes (see Figure 2).

Image
Fig 2: Indicative risk-return profile by archetype
Image
Fig 2: Indicative risk-return profile by archetype

Implications for investors

As competition intensifies, channel strategy should become a core diligence priority rather than a secondary commercial consideration.

Several areas warrant particular attention:

  • Assess pricing dispersion across channels. Significant variation between pharmacy, retail, Amazon and DTC pricing can indicate weakening channel discipline and future margin pressure. In practice, weaker performers often exhibit price dispersion exceeding 20% across channels versus closer to 10% for leading brands with stronger pricing control.
  • Separate consumer awareness from recommendation strength. Pharmacist endorsement remains a critical indicator of brand health for pharmacy-led businesses, particularly in a market where pharmacies still represent approximately 15%-20% of skincare sales and continue to play an important role in recommendation-led purchasing.
  • Stress-test customer acquisition assumptions for digitally native brands. International experience has shown that customer acquisition costs can rise materially as brands scale, particularly once organic growth gives way to paid acquisition. In several international DTC beauty models, conversion economics that appeared attractive below €30 million of revenue deteriorated significantly beyond €50 million as brands exhausted their organic audience and competed for increasingly expensive performance marketing inventory.
  • Evaluate international expansion potential carefully. Pharmacy-led Spanish brands with strong clinical positioning and dermatologist relationships may have meaningful expansion opportunities in Latin America, particularly in Mexico, Colombia and Peru.
  • Prioritise channel strategy early in ownership. Brands that successfully recover from channel conflict typically move quickly to reinforce pricing architecture and portfolio differentiation before existing distribution agreements renew. Delayed intervention can embed 12-18 months of avoidable margin pressure.

The Spanish dermocosmetics market remains attractive, but it is not a homogeneous category. It consists of structurally different business models with distinct economic characteristics, risk profiles and competitive advantages.

The brands most likely to create durable value over the next decade will be those that maintain disciplined channel positioning while building the commercial infrastructure required to support long-term expansion. For investors, understanding channel architecture is becoming increasingly important in distinguishing genuinely defensible assets from businesses benefiting primarily from short-term category momentum.

L.E.K. Consulting advises investors and consumer brands on growth strategy, channel optimisation and value creation across the beauty and personal care sector. To discuss these themes further, contact our Consumer practice team.

L.E.K. Consulting is a registered trademark of L.E.K. Consulting. All other products and brands mentioned in this document are properties of their respective owners. © 2026 L.E.K. Consulting

English

From Market to Innovation Hub

China's Role in Pharma
June 9, 2026


This video examines China’s evolving role in the global pharmaceutical industry, highlighting its transition from a major commercial market to a growing center of innovation, manufacturing, and strategic partnerships. It explores how government-led healthcare initiatives and continued investment in biopharmaceutical innovation are creating new opportunities for multinational companies seeking growth in China and across the broader Asia-Pacific region.

L.E.K. Consulting is a registered trademark of L.E.K. Consulting LLC. All other products and brands mentioned in this document are properties of their respective owners. © 2026 L.E.K. Consulting LLC 

English

Commercialization in APAC Pharma

From Operational Capability to Strategic Asset
June 9, 2026


This video explores the growing importance of commercialization platforms in the Asia-Pacific pharmaceutical market. It highlights how these platforms help biopharma companies navigate the region’s fragmented healthcare landscape by providing regulatory, market access, commercial, and operational capabilities across multiple markets. The discussion also examines increasing investor interest in commercialization platforms as scalable growth and value-creation vehicles.

L.E.K. Consulting is a registered trademark of L.E.K. Consulting LLC. All other products and brands mentioned in this document are properties of their respective owners. © 2026 L.E.K. Consulting LLC 

English

Commercial Excellence in Pharma Japan

The Key to Success
June 9, 2026


This video explores what commercial excellence means in Japan’s pharmaceutical market and why global strategies often require significant localization to succeed. It highlights the importance of deep KOL engagement, precision healthcare provider targeting, and omnichannel execution, while emphasizing that commercial agility and market-specific execution are critical drivers of product uptake, pricing success, and long-term brand performance.

L.E.K. Consulting is a registered trademark of L.E.K. Consulting LLC. All other products and brands mentioned in this document are properties of their respective owners. © 2026 L.E.K. Consulting LLC 

English
Subscribe to