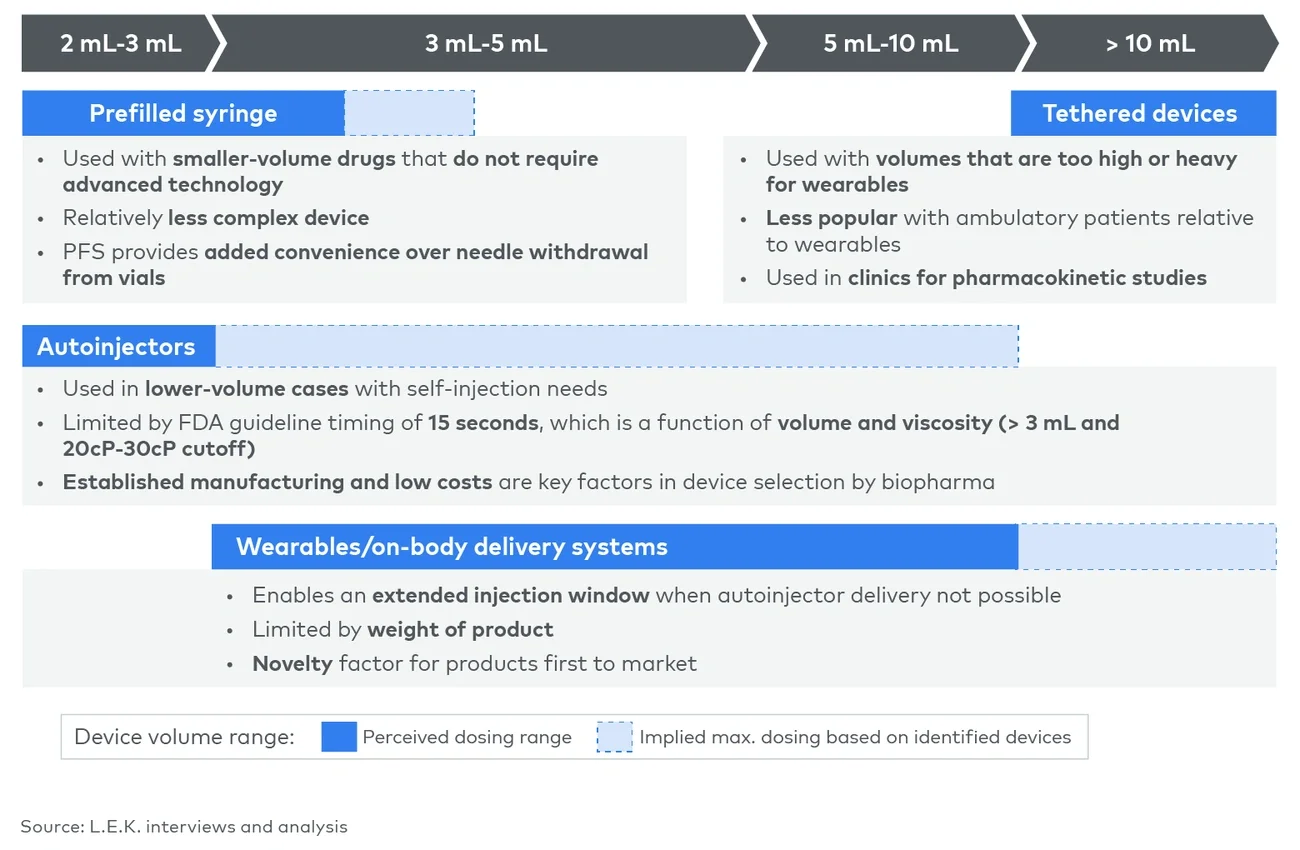
Traditional prefilled syringes (PFS) and autoinjectors are less common above 3 mL, reflecting the physical space limitations and the Food and Drug Administration’s 15-second guidance for autoinjectors. More innovative autoinjectors are in development that may deliver up to 10 mL, with some models using gas rather than spring power to avoid pressure limitations.
On-body delivery systems are wearable devices that allow extended delivery timelines (minutes, hours), without restricting patient mobility. Manufacturers of such devices include Enable Injections, West, Ypsomed and BD. These devices often come with a novelty factor but are limited by the weight of the drug volume.
Tethered devices, typically pump systems, offer consistent delivery of large volumes over extended timelines though often with greater constraints on patient mobility. Manufacturers include Koru and EMED.
Importantly, for large-volume drugs, an innovative delivery device is not required. Multiple simpler devices (e.g., prefilled syringe) could be used. Alternatively, a large volume could be manually pushed by syringe, although this requires training and a greater time commitment.
In practice, device selection is shaped not only by volume but also by the interplay between viscosity, administration time, user/administration setting, cost, risk and the strategic value of convenience. No single technology is optimal across all volumes and use cases.
Demand is increasing
Though the number of approved large-volume drugs remains relatively limited today (around 30 in 2023), it has grown steadily and there are additional assets in the pipeline. As more reach the market, the classes of molecules are expected to diversify. For example, most approved drugs greater than 10 mL are subcutaneous immunoglobulins, with few of that class in the late-stage pipeline. Not all leverage an innovative delivery system today, but they have that potential.
Several trends are likely to support future demand for large-volume delivery solutions:
- Intravenous-to-subcutaneous conversion
Several companies have introduced subcutaneous versions of their intravenous products (e.g., Darzalex, Keytruda). These products often leverage novel formulation technologies (e.g., Halozyme, Alteogen) to modulate tissue permeability. These conversions offer patients convenience benefits (e.g., speed, at-home dosing), while potentially improving infusion-center throughput. For manufacturers, these products offer life-cycle management benefits (e.g., patent coverage, enhanced value proposition). - Rise of long-acting injectables
Several historically oral markets (e.g., schizophrenia, HIV) have evolved to offer more routes of administration options. These next-generation agents have shifted toward less-frequent injectable dosing. These products may reduce pill fatigue, improve adherence and offer greater privacy (avoiding stigma), with the potential to improve real-world outcomes. - Policy incentives
New molecular entities or fixed-dose combinations of “active” agents are seen as separate products from originators under Inflation Reduction Act Medicare Price Negotiation. This allows a reset of the negotiation clock for franchises able to convert patients to the next generation. Separately, plasma-derived products are exempt, with immunoglobulin being among the highest-volume subcutaneous drugs.
Countervailing forces remain. Large-volume drug delivery may see competition from formulation technologies that aim to reduce injection volume (e.g., Elektrofi). Additionally, novel oral therapies may erode demand in historically injectable markets (e.g., diabetes/obesity).
Growth will be shaped by molecular complexity, commercial incentives and new enabling technologies.
Device innovators face market challenges
Despite innovation in the delivery device field, drug manufacturers tend to be highly risk averse. When possible, manufacturers often opt for basic packaging or devices (e.g., vial, prefilled syringe) or even two smaller injections. Novel devices may carry development risk. Less commonly leveraged devices may carry supply chain risk. Added devices can increase the risk of malfunction. On top of the risks, innovative devices typically increase the cost of goods sold over more commoditized options, placing pressure on margins. Often, innovative drug delivery device selection is driven by the product’s requirements (e.g., volume, viscosity) or market conditions (e.g., competitive differentiation, life-cycle management benefits).
When pursuing a large-volume drug delivery device, drug manufacturers are often focused on the device manufacturer’s track record, which provides confidence in manufacturing capabilities and product performance. As a result, proven manufacturing and performance can become a meaningful barrier to entry for newer device players.
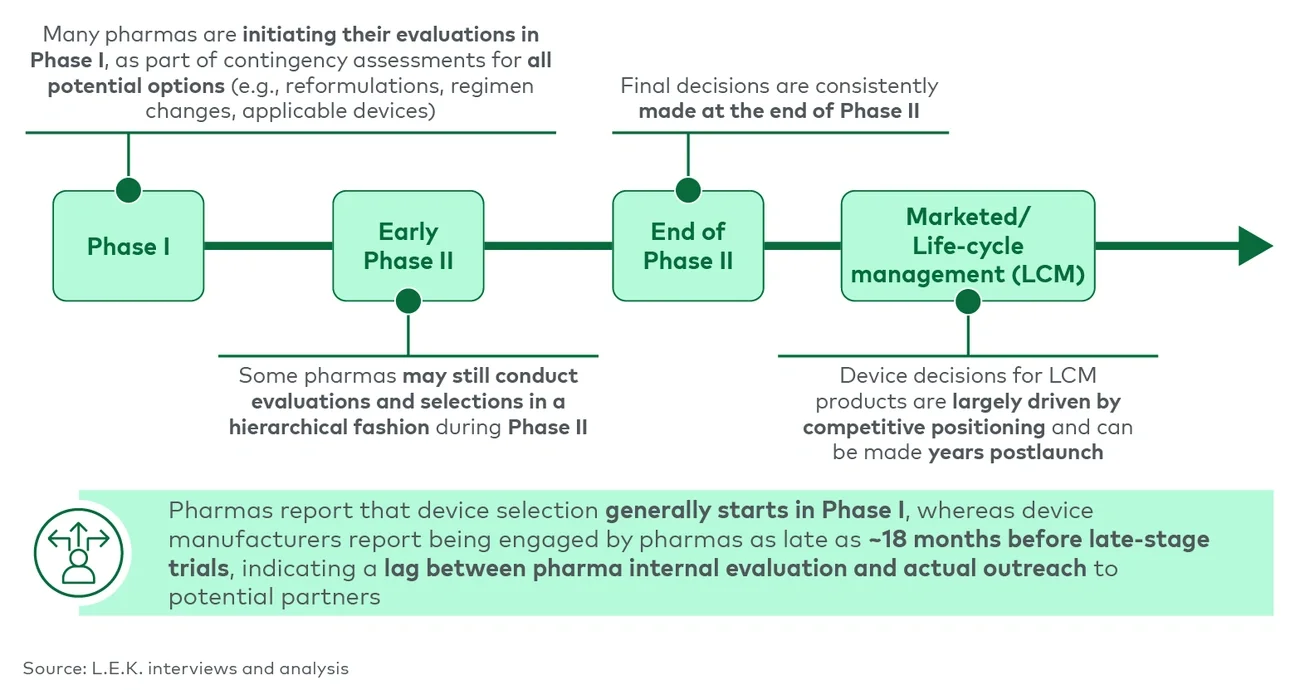
For large-volume device players, identifying potential customer targets can also be a challenge (see Figure 2). Which drugs will be large volume? When developing a new drug, manufacturers typically evaluate delivery device options early in clinical development, alongside other dosing contingency options (e.g., reformulations, regimen changes). At this stage, the drug volume is not yet finalized or publicly disclosed. Life-cycle management decisions are less consistent and can be driven by competitive positioning and exclusivity considerations several years postlaunch. Which marketed intravenous drugs might reformulate to a large-volume subcutaneous injection? Which marketed large-volume subcutaneous injections would benefit from a new device?


 Source: