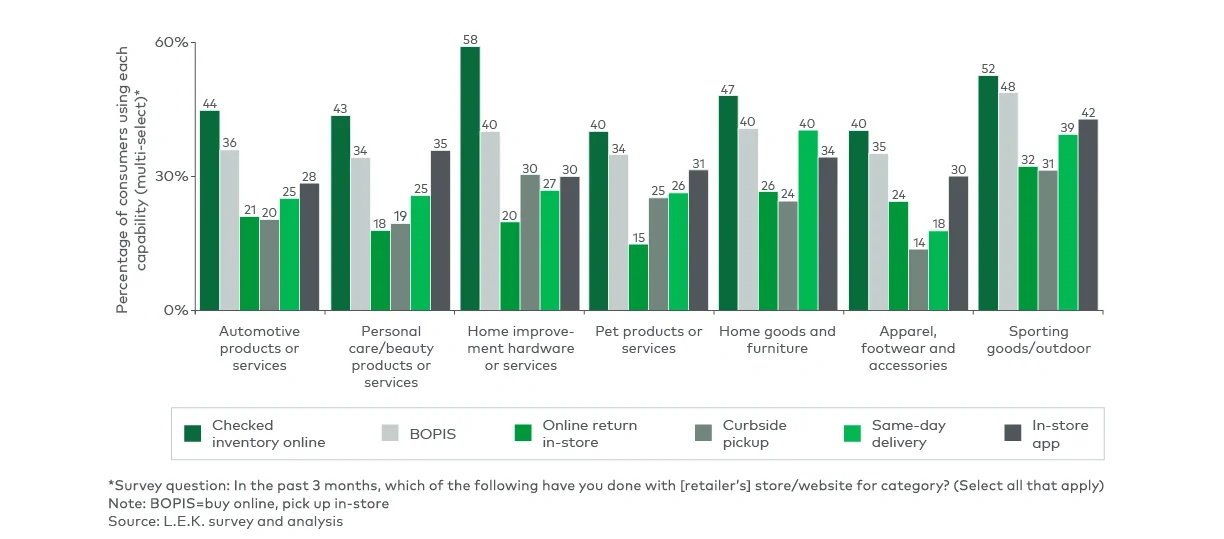
These capabilities are often critical to completing the trip efficiently. Home Depot illustrates this in project-based home improvement, where purchases require both planning and immediate execution. Investments in real-time inventory visibility, buy online/pick up in store and same-day fulfillment enable customers to quickly source the right products and support high-intent trips.
Retailers are also embedding digital and AI-enabled tools into their service models to reduce friction. Target, for example, has deployed a customer-facing AI agent to resolve postpurchase inquiries, improve response times and reduce reliance on in-store and call center staff. By automating routine interactions and surfacing information more efficiently, these tools free up associates to focus on higher-value needs. These capabilities complement traditional omnichannel services such as curbside pickup and same-day fulfillment, supporting both planned and immediate purchase occasions.
Omnichannel functionality is no longer a point of differentiation but a baseline expectation. Retailers that execute well will reduce friction and capture demand, while those that fall short risk losing relevance in the consideration set.
4. Assortment relevance drives repeat visits
Retailers must offer assortments that directly connect to the needs of the missions they are trying to capture. Depending on the need being served, consumers are more likely to return to retailers that consistently introduce new products, align with evolving preferences and deliver strong value alongside frequent restocking. Most often, consumers are seeking well-curated assortments instead of overly broad assortments when shopping in physical stores.
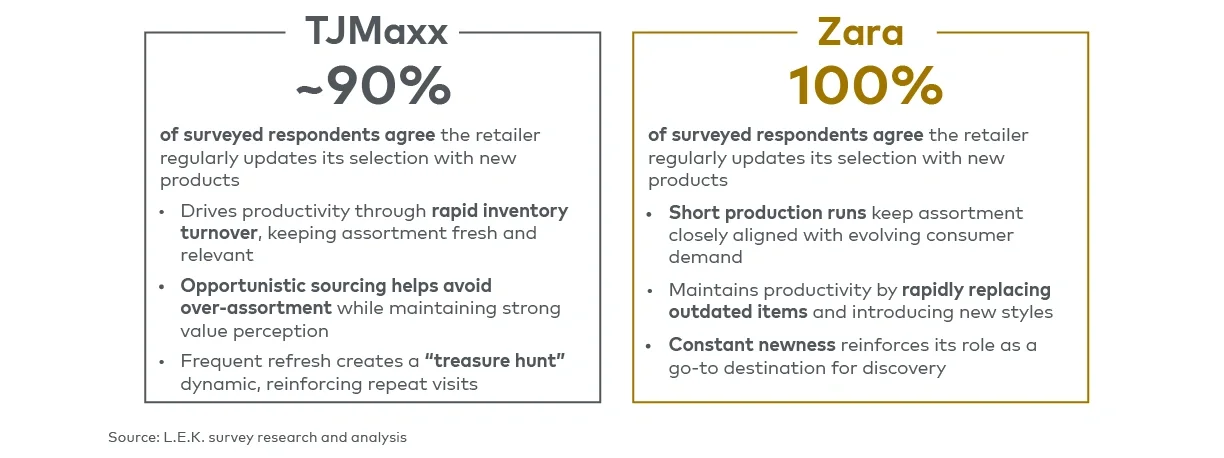
Assortment relevance is a key determinant of whether a retailer remains in the consideration set over time. Zara exemplifies this, leveraging a vertically integrated model to introduce new styles rapidly, stay aligned with emerging trends and offer fashion at accessible price points. This combination of newness and value reinforces its position as a destination for discovery and drives frequent visits (see Figure 8).
A similar effect is seen in off-price retail, where TJX sustains traffic through continuously changing assortments driven by opportunistic buying and high inventory turnover, enabling it to offer branded products at compelling value. The resulting “treasure hunt” experience encourages repeat visits, as consumers expect new finds each time they shop (see Figure 8).
By contrast, retailers that default to undifferentiated assortment lose repeat engagement and fall out of the purchase journey. Maintaining a dynamic, relevant assortment that delivers strong value against the specific needs of the consumer’s shopping mission is therefore critical not only for conversion, but also for sustaining long-term traffic and customer loyalty.