Executive Insights

Too Much Money, Too Few Rocks: Successful Strategies in US Construction Aggregates

October 7, 2025

Key takeaways

The U.S. construction aggregates market remains highly attractive due to its size, high margins, price resilience and ample room for consolidation.  


Despite intense competition and high acquisition multiples, successful platforms have scaled by leveraging experienced leadership, regional density, bolt-on M&A, vertical integration where needed and operational excellence — particularly pricing and procurement.  

While these levers still matter, new opportunities are emerging, including greenfield developments where local pricing supports strong unit economics, growing interest in recycled concrete aggregates and potential in quarry backfilling for inert waste. 

Taken together, the next phase of growth will reward platforms that combine proven methods with forward-looking investment theses.  

A fundamentally attractive sector

U.S. construction aggregates are a fundamentally attractive industry — a large market (approximately $40 billion) with high profitability (20%-35% typical EBITDA for crushed stone, 10%-30% for sand and gravel, with a high conversion to free cash flow) and significant room for further consolidation, as the top 10 players still only represent roughly a 40% share nationally despite significant M&A activity (see Figure 1).

Figure 1

A highly profitable industry with significant runway for further consolidation

Image
A highly profitable industry with significant runway for further consolidation

Figure 1

A highly profitable industry with significant runway for further consolidation

Image
A highly profitable industry with significant runway for further consolidation

While the construction industry is cyclical by nature, construction aggregates display more resilience than most pockets of the market with regard to both price and volume.

Price resilience is particularly strong: In the past few decades, U.S. aggregate prices only declined once, by about 1.5%, at the lowest point of the Great Financial Crisis (GFC) — a dip partially explained by negative mix effects as lower-value road base and fill materials did not decline in volume like the rest of the market. This resilience is anchored in low fixed costs and small serviceable markets, where a decision to increase volume faster than the market can bear quickly leads to market-wide price declines. Further, regulatory pressures have made permitting increasingly challenging and the continued urban sprawl of major U.S. cities has made land more scarce (see Figure 2). 

Figure 2

Highly resilient prices with above-inflation pricing growth

Image
Highly resilient prices with above-inflation pricing growth

Figure 2

Highly resilient prices with above-inflation pricing growth

Image
Highly resilient prices with above-inflation pricing growth

Construction aggregate volumes have historically been more cyclical but are now primarily driven by infrastructure demand, which is supported by very healthy state and local finances. Residential demand is also supported by healthy fundamentals — with housing starts likely to land at 1.3 million for 2025, at the lower end of the range justified by underlying demographic needs. Overall, while the industry’s cyclicality cannot be abolished, the risk of a major decline in aggregate volumes appears limited (see Figure 3, parts 1 and 2).

Figure 3 (part 1)

U.S. aggregate volume demand, by end market (2025)

Image
U.S. aggregate volume demand, by end market (2025)

Figure 3 (part 1)

U.S. aggregate volume demand, by end market (2025)

Image
U.S. aggregate volume demand, by end market (2025)

Figure 3 (part 2)

U.S. housing starts, by housing type (1985-2025E)

Image
U.S. housing starts, by housing type (1985-2025E)

Figure 3 (part 2)

U.S. housing starts, by housing type (1985-2025E)

Image
U.S. housing starts, by housing type (1985-2025E)

Too much money, too few rocks

With that backdrop, it’s no surprise that the competition for assets is intense. Aggregate industry majors are continuing to pursue the consolidation of the sector, and with trading multiples north of 15x EV/earnings before interest, taxes, depreciation and amortization (EBITDA), their firepower is broadly unmatched in the market. Cement majors, both international and domestic, are also actively looking to increase their exposure to U.S. construction aggregates and have ample resources to do so.

Finally, a number of midsize operators — aggregate pure plays but also ready-mix concrete and asphalt players — have made U.S. aggregates a strategic priority for their expansion.

Lessons learned from historically successful acquisition platforms

Despite intense competition, multiple operators have been able to build successful acquisition platforms over the years — among others, names such as Rogers, IMI, Blue Water and Burnco come to mind. Studying those success stories points to a few key levers of value creation:

  • Regional density and network connectivity increase efficiency and improve local market structures.
  • Experienced leadership and patient capital help build relationships with prospective targets, achieve off-market deals when they become available and increase talent retention.
  • Small, bolt-on acquisitions can go a long way; $5 million to $10 million deals are not transformational, but they add up over time.
  • Vertical integration can be necessary to build an outlet for aggregates in specific markets. Asphalt is as strong or stronger a lever as ready-mix concrete but often requires getting into labor-intensive paving services.
  • Operational excellence pays in the long run, through incremental investment capacity and increased retention of key talent that builds the firm’s reputation. Data-driven pricing and optimized procurement are often the strongest value creation levers. 

New growth pathways — greenfields, recycled aggregates, quarry backfilling?

While lessons from past success stories continue to be relevant, new opportunities are also emerging.

The most immediate is the greenfielding of new quarries and pits. Over recent decades the industry has increasingly shied away from large greenfields due to increased permitting and land scarcity challenges and post-GFC overcapacities. As a result, the number of active pits and quarries is now lower than it was in 2000 and has barely stabilized in recent years.

However, aggregate prices in many local markets are now at levels that make greenfield economics highly attractive for players that are willing to go through the permitting process and challenge the local status quo. Identifying those markets is an opportunity for players looking to gain scale.

Recycled concrete aggregates are a more nascent opportunity. Recycled concrete is now overwhelmingly routed toward lower-value applications (road base, pipe bedding, etc.) rather than reused in concrete, largely due to quality concerns among U.S. concrete producers. However, reuse of the coarse material in concrete has become widespread in other parts of the world, confirming the technical feasibility of that option.

Several operators are now pushing that option in the U.S., gaining traction in parts of both the South and the Pacific Northwest in particular. This is an opportunity for operators to enter a market in an early inning by identifying areas where there is enough difference between road base and virgin aggregate prices to justify the added processing and logistics of recycling.

Finally, quarry backfilling is an opportunity that deserves a fresh look. With landfill tipping fees now above $60 in a majority of the U.S., and above $80 in regions like the Northeast, there is large profit potential for players willing to go through permitting processes. In Europe, individual locations achieve EBITDA rates over 50% on their backfilling activities without requiring significant investments, by filling depleted quarry space with inert construction and demolition waste. This activity also plays a role in community relations, as the depleted quarry space is ultimately returned to nature by adding a layer of new soil.

While low landfill tipping fees have historically made that option unattractive in the U.S., the rapid increase in those fees and an increasing shortage of landfill space in specific regions may be creating an overlooked opportunity for aggregate players.

For more information, please contact us

English

Tariffs at the Checkout: How U.S. Consumers Are Reacting to Price Pressure

October 7, 2025

Most U.S. consumers believe they are shouldering the cost of tariffs, and many are changing what, where and how they shop. L.E.K. Consulting’s research shows that nearly half are already paying more than they think is acceptable, with apparel, durable goods and beauty products most at risk.

Our latest infographic highlights the categories under pressure, how consumers are trading down and where businesses must act to stay relevant. Learn how we help companies respond to shifting consumer expectations, adjust pricing strategies and protect customer loyalty.

Tariffs at the Checkout: How U.S. Consumers Are Reacting to Price Pressure

Get in touch with us to discuss how to navigate tariffs and uncertainty with precision.

L.E.K. Consulting is a registered trademark of L.E.K. Consulting. All other products and brands mentioned in this document are properties of their respective owners. © 2023 L.E.K. Consulting

English

Australia's Private Healthcare Sector: Strategic Outlook and Opportunities

October 6, 2025

Australia’s private health sector is at an inflection point. In this video, L.E.K. Consulting’s Chris Bartlett outlines the structural challenges reshaping the sector — from rising costs and demographic pressures to evolving consumer expectations. He also explores the opportunities ahead, including digital innovation, value-based care models, and integration across the broader health ecosystem.

L.E.K. Consulting is a registered trademark of L.E.K. Consulting LLC. All other products and brands mentioned in this document are properties of their respective owners. © 2025 L.E.K. Consulting LLC

English
Executive Insights

Behavior-First Biopharma Go-to-Market Strategies

October 6, 2025

Key takeaways

L.E.K. recommends a behavior-first approach to biopharma go-to-market strategy, starting with the simple but powerful question: which stakeholder behaviors must change for patients to start and stay on treatment?

While it may be tempting to rely on benchmarks and inherited frameworks, applying this behavioral lens at the go-to-market strategy stage focuses resource allocation on the most important adoption barriers and aligns functions around shared outcomes.
 

Prioritizing these behaviors then guides the right mix of personal and non-personal engagement, choreographed to educate, persuade, enable and remind stakeholders in ways most likely to shift adoption.

To succeed, leaders should anchor the go-to-market strategy in data, work cross-functionally, measure performance against prespecified outcomes-based KPIs and recalibrate as needed to ensure the strategy remains targeted and effective.

Start with the right question

Biopharma go-to-market planning today demands a new level of precision and flexibility. Commercial leaders are facing mounting pressures from rising costs, constrained budgets and intensifying competition. Meanwhile, richer claims datasets, greater computing power and an expanding menu of engagement approaches provide more insights and options than ever, making it more complex to choose which levers matter most.

Despite this, companies may be tempted to rely on benchmarks and inherited frameworks to design their go-to-market strategies. But in our experience advising on a broad range of launches, we recommend starting by asking one deceptively simple question first:

Which behaviors, in which stakeholders, need to be changed for patients to start and stay on treatment?

Approaching the challenge through a behavior-first lens naturally sharpens decision-making. It encourages functions to align around shared outcomes rather than siloed tasks and deploy the right interventions at the moments that matter most. Too often, this behavioral lens is applied only later — for example, at the brand planning stage — rather than earlier when it can shape go-to-market strategy itself. Capturing these insights up front requires more investment than most organizations are used to, but it pays dividends in sharper execution later.

In this edition of L.E.K. Consulting’s Executive Insights, we propose a five-step process for developing and continuously refining the go-to-market strategy (see Figure 1).

Figure 1

Behavioral-driven process for developing a go-to-market strategy

Image
Behavioral-driven process for developing a go-to-market strategy

Figure 1

Behavioral-driven process for developing a go-to-market strategy

Image
Behavioral-driven process for developing a go-to-market strategy

1. Determine (reassess) adoption drivers and barriers

We suggest companies begin by defining the full set of stakeholders whose behaviors influence adoption — core groups like prescribers, patients and payers, as well as caregivers, referring physicians, clinic administrators, nurses, distributors, pharmacies, genetic counselors, professional societies or associations, and patient advocacy groups. The next step is to map the journey each stakeholder takes, from symptom recognition to treatment initiation and ongoing use, and to pinpoint the specific behaviors required at each stage to drive adoption and persistence. This process identifies both barriers that block adoption and drivers that substantiate it, providing the foundation for go-to-market design by showing where momentum builds and where it breaks down (examples of barriers for some key stakeholders are shown in Figure 2).

Figure 2

Examples of barriers to adoption across select stakeholders

Image
Examples of barriers to adoption across select stakeholders

Figure 2

Examples of barriers to adoption across select stakeholders

Image
Examples of barriers to adoption across select stakeholders

2. Prioritize stakeholders and behaviors to change

No product launch can — or should — target every potential prescriber, patient or influencer equally. The starting point is identifying those who will most directly drive adoption and, within each group, the subset that could have the largest impact with focused engagement. For healthcare providers (HCPs), that might mean the 20%-30% of specialists who account for the majority of prescribing or patient volume in a category; for patients, it could mean those most likely to switch therapies within the next 12 months rather than the entire diagnosed population. It is also critical to identify the stakeholders that determine or influence the therapy’s market access — payers, institutional decision-makers and clinical guideline committees — since their choices determine how broadly adoption is even possible.

With priority stakeholders identified, teams should next prioritize the behavior changes needed to drive adoption. Each behavior should be viewed through two lenses: the impact if successfully changed and the ability to influence that change. The impact should be linked to measurable outcomes, such as incremental treated patients, revenue per claim or avoided discontinuations. Doing this well requires strong business insights and analytics capabilities to translate claims data and market research into clear implications for go-to-market strategy.

The ability to influence then screens for feasibility: which barriers sit within the manufacturer’s realm of control and which demand broader policy, infrastructure or socioeconomic shifts. For example, rural clinics may lack access to advanced imaging required for diagnoses; expanding regional scanner capacity would accelerate uptake, but the manufacturer cannot feasibly build or finance new facilities.

Finally, companies must take a balanced approach to addressing the behavior changes. For instance, a campaign focused on the therapy’s value proposition versus its competitors will have limited impact if the disease remains highly undiagnosed upstream or has significant payer coverage restrictions.

3. Identify engagement approaches required

With priority behaviors identified, behavior change is most often supported by a combination of personal and nonpersonal engagement. Except where personal engagement is restricted or cost-prohibitive, high-performing go-to-market plans choreograph both forms of engagement around each behavior change.

The process typically starts by clarifying what is needed to shift the behavior — educating, persuading, enabling or reminding — and then weighing potential approaches, competitor activity and cost versus impact before settling on the right mix (see Figure 3).

Figure 3

Selecting the mix of personal and nonpersonal engagement approaches

Image
Selecting the mix of personal and nonpersonal engagement approaches

Figure 3

Selecting the mix of personal and nonpersonal engagement approaches

Image
Selecting the mix of personal and nonpersonal engagement approaches

For behaviors that require persuasion through nuanced, individualized dialogue — such as deciding to prescribe a therapy with complex risk-benefit trade-offs — personal promotion is the anchor. A live conversation with a medical science liaison (MSL) can surface concerns no digital banner could. Even so, nonpersonal tools — like a short explainer video, follow-up text or concise evidence digest — help educate prior to making a decision and reinforce the exchange after a decision has been made.

When the barrier to the behavior change stems from a straightforward information gap, recognition lapse or procedural misstep, scaled digital tactics focused on educating, enabling and/or reminding can shoulder more of the load. Take physician office activation for prior authorization as an example: Interactive microlearning modules, autopopulated checklists in the electronic medical record (EMR) system and real-time status alerts can standardize submissions and cut cycle time. A field reimbursement manager remains on call for escalations, providing a targeted human touch when digital alone is not enough.

Personal engagement: Design the customer-facing model
Delivering the personal side of engagement requires a clear customer-facing model with a blueprint for which roles engage which stakeholders and how those interactions are coordinated.

Certain roles — sales representatives, MSLs and national account managers — form the backbone of nearly every launch. During go-to-market planning, companies must decide which additional roles to layer on and at what scale.

This should be dictated by the behaviors the company has prioritized and the skills required to shift them. If diagnostic inertia is a constraint, deploy diagnostic specialists who can walk clinicians through test-ordering workflows. If access friction is resulting in patient drop-off, plan for a robust field reimbursement manager force to navigate prior authorization appeals and benefit investigations. When administration is complex, nurse educators equipped to train infusion sites and coach patients become critical.

Equally important, coordinate these specialists’ outreach so stakeholders experience a seamless dialogue — not a barrage of overlapping touchpoints.

The customer-facing model assigns the right roles to the right behaviors, maintains the necessary share of voice and reserves human expertise for the moments when personal engagement drives outcomes.

Deploy nonpersonal engagement
Nonpersonal engagement is also critical for behavior change and demands the same disciplined planning as personal engagement. At the go-to-market strategy stage, the goal is to match each prioritized behavior with the nonpersonal approaches most likely to shift it, gauge the investment those approaches will require and surface net new capabilities — such as EMR system integration or modular content operations — so budgets and roadmaps are grounded before detailed tactical planning begins.

The most effective programs anchor nonpersonal engagement in the behavior that needs to shift and what it will take to make that happen. Take the example of slow adoption of a new biomarker test despite guideline inclusion, where nonpersonal engagement approaches are coordinated to collectively educate HCPs about the biomarker test, persuade them of the benefits of using it, enable them to easily order it and remind them on an ongoing basis when patients are appropriate for that test (see Figure 4).

Figure 4

Examples of nonpersonal engagement approaches mapped to a behavior to change

Image
Examples of nonpersonal engagement approaches mapped to a behavior to change

Figure 4

Examples of nonpersonal engagement approaches mapped to a behavior to change

Image
Examples of nonpersonal engagement approaches mapped to a behavior to change

The best-performing companies treat nonpersonal engagement as a precision tool — designed, budgeted and measured with the same rigor as personal engagement. They ensure that nonpersonal engagement is highly personalized, with messages customized and channels tailored to individual stakeholders’ needs and preferences. They also monitor and rapidly integrate emerging innovations into the engagement mix as appropriate.

4. Determine (adjust) go-to-market scale and investment level

With priorities and engagement approaches defined, teams must right-size the effort. This means translating the strategy into the required investment, talent, technology and vendor support. That assessment should also account for the technology (e.g., customer relationship management platforms, modular content platforms, omnichannel orchestration platforms and data integration capabilities) that will be needed to execute engagement efficiently and at scale. If the plan exceeds available resources, adjustments might include narrowing the target audience, phasing deployment or substituting lower-cost tactics that still address the barrier. The aim is not simply to fit the budget but also to ensure resources are sufficient to overcome key barriers without overspending on low-impact activities.

5. Execute and track impact

Next, the focus shifts to execution and ongoing measurement. Uncertainties are inevitable — competitor entry, evolving stakeholder needs and the emergence of new barriers can alter the market landscape. Teams should anticipate these possibilities through scenario planning and establish clear decision triggers in advance. The impact should be measured against prespecified outcomes-based key performance indicators, not just activity levels.

This measurement process feeds directly into the next cycle — reassessing progress against existing barriers, identifying new ones and refining the engagement plan accordingly. Teams should continually assess which approaches are delivering impact and which are not and adjust the mix as needed. Adjustments must be made carefully, particularly where established stakeholder relationships could be disrupted, but also decisively and with agility. Taking a cyclical, data-driven approach to go-to-market strategy ensures it remains responsive, targeted and effective over time.

Takeaways for executives

In today’s fast-moving market, it is easy to default to familiar tactics executed within individual functions without stepping back to ensure they are aimed at the highest-priority stakeholder behaviors to change. A behavior-first go-to-market approach counters that tendency by focusing on the most important adoption barriers and aligning resources to overcome them. It also empowers teams to address downstream workflows, especially brand planning, allowing them to build on this base and consider the attitudes and emotions that are so important for personalizing messages and channels to each stakeholder.

To put this approach into practice, executives should focus on five imperatives (see Figure 5).

Figure 5

Imperatives for behavior-first go-to-market strategy

Image
Imperatives for behavior-first go-to-market strategy

Figure 5

Imperatives for behavior-first go-to-market strategy

Image
Imperatives for behavior-first go-to-market strategy

When applied with discipline, effective go-to-market strategies can cut through the noise of competing priorities and keep the organization focused on what will truly drive adoption. The companies that revisit those priorities regularly and act on them in a coordinated and decisive way will be the ones that turn intent into sustained market impact.

Note: AI tools were used to support this article.

For more information, please contact us.

L.E.K. Consulting is a registered trademark of L.E.K. Consulting LLC. All other products and brands mentioned in this document are properties of their respective owners. © 2025 L.E.K. Consulting LLC 

English

The Power of Operational Due Diligence

October 6, 2025

In a world where private equity firms can no longer rely on leverage and multiple arbitrage, operational due diligence has become more important than ever. Find out more in our full keynote interview for Private Equity International.

English

2025 U.S. Health System Executive Survey: Regulatory Priorities and Planned Actions Post-OBBBA

October 3, 2025

Each year, L.E.K. Consulting surveys hundreds of hospital and health system executives to understand their outlook for the year ahead, their strategic priorities and the specific actions their systems plan to take over the coming (approximately) three years. This year, L.E.K. fielded this annual survey in late July and early August 2025, just weeks after the passage of the One Big Beautiful Bill Act (OBBBA), providing a unique view into the policy changes executives are most concerned about — and how hospitals are responding to these and other potential regulatory changes (see Figure 1).

Image
Figure 1. Federal policy changes included in L.E.K.’s 2025 health system executive survey
Image
Figure 1. Federal policy changes included in L.E.K.’s 2025 health system executive survey

Top concerns for health system executives

Executives are most concerned about Medicaid and Affordable Care Act (ACA) changes passed in the OBBBA, 340B reform, and tariffs. The results are clear: More than half of the respondents believe that the impact of each of these policy changes on their organizations will be significant (see Figure 2).

Image
Figure 2. Hospital executive views on most impactful federal policy changes
Image
Figure 2. Hospital executive views on most impactful federal policy changes

Medicaid and ACA enrollment losses

One key area of concern for respondents is the expected decline in Medicaid and ACA marketplace enrollment. The resulting increase in uninsured patients could drive higher levels of uncompensated care and decreased patient volumes for elective services. Decreased Medicaid volume also poses a direct threat to 340B eligibility.

Survey respondents are already taking steps to respond. Executives highlighted three areas of focus (see Figure 3):

  • Reprioritizing service line investments toward areas with better margins
  • Exploring strategic partnerships with payers, physician groups and community organizations that can help them maintain financial health
  • Advocating for state-specific policy relief, such as urging governors and Medicaid agencies to seek flexibility in 1115 waiver design (e.g., broader exemptions, simplified reporting or phased timelines) to soften the impact of new eligibility requirements
Image
Figure 3: Hospital/health system executive actions to prepare for Medicaid and ACA enrollment losses
Image
Figure 3: Hospital/health system executive actions to prepare for Medicaid and ACA enrollment losses

340B program reform

The 340B program is a critical source of support for a majority of U.S. health systems, contributing to the ability of providers to sustain access and invest in care across rural, community and urban settings. The Trump administration is already piloting a rebate program (as opposed to the up-front discounts that are the normal 340B mechanism) and has begun initial steps toward reducing reimbursement for 340B-purchased drugs. Additionally, legislative proposals under discussion would further tighten eligibility, limit contract pharmacy use and reduce the scope of covered outpatient drugs.

In response, hospitals are already acting (see Figure 4):

  • Modeling financial scenarios to understand how different reform pathways would affect margins and identifying offsetting levers
  • Reevaluating contract pharmacy arrangements, prioritizing those serving high Medicaid and underserved populations, to strengthen compliance positioning and demonstrate alignment with 340B’s intent
  • Engaging legal and policy advocacy resources to track regulatory developments, prepare for audits and influence the direction of potential 340B reforms
     
Image
Figure 4. Hospital/health system executive actions to prepare for potential 340B reform
Image
Figure 4. Hospital/health system executive actions to prepare for potential 340B reform

Tariffs

Another pressing issue for hospitals is the impact of tariffs. While tariffs are not targeted at medical products specifically, many critical supplies and pieces of equipment are sourced from countries subject to these trade measures — leaving hospitals exposed to rising costs and ongoing uncertainty about future duties.

Hospitals are adjusting their supply chain strategies to mitigate tariff impacts (see Figure 5):

  • Renegotiating contracts and consolidating purchasing to offset higher costs and capture scale discounts
  • Shifting suppliers toward both domestic sources and less-tariffed countries in order to reduce exposure to trade policies
  • Managing inventory and contract terms by increasing stock of high-risk items and using long-term agreements to hedge against future price spikes
Image
Figure 5. Hospital/health system executive actions to respond to tariffs
Image
Figure 5. Hospital/health system executive actions to respond to tariffs

Planning for what’s next

It is clear that hospitals are not waiting on the sidelines. Leaders are actively scenario-planning, restructuring supply chains, tightening compliance and seeking partnerships to protect margins and sustain care delivery.

We work with provider organizations to respond to these pressures with structured strategies. Our teams help executives assess regulatory risks and their financial implications, drive cost improvements, transform operational performance and make disciplined decisions on capital deployment and partnership strategies to support both near-term stability and long-term sustainability.

If you are interested in discussing how L.E.K. can support your organization in navigating these challenges, please reach out to us.

L.E.K. Consulting is a registered trademark of L.E.K. Consulting LLC. All other products and brands mentioned in this document are properties of their respective owners. © 2025 L.E.K. Consulting LLC

English
Executive Insights

Global-Local Governance in Pharma Launches: Enabler of Success or Hidden Bottleneck?

October 3, 2025

Key takeaways

Global launches are critical for biopharma, offering diversification, value generation and life cycle extension despite lower ex-US margins.
 

Top performers use modular country plans, sequenced investments and real-time KPIs to manage complexity and course-correct.

Launches often falter when local insights are missing or governance is fragmented, highlighting the need for early alignment and clear decision rights.

Flexible governance tailored to market priority and resourcing ensures global consistency while adapting to local needs.

Achieving global launch ambitions requires well-coordinated ex-US execution

Biopharma companies are best positioned for success when launches are designed with a truly global footprint. While many U.S.-based organizations prioritize their home market, the majority of patients, and often a substantial share of commercial opportunity, reside outside the U.S. Even though net profit per patient in many ex-U.S. markets is typically 20% to 40% lower due to stricter pricing controls and slower uptake (see Figure 1), global launches remain vital. They deliver:

  • Risk diversification across price reference baskets and portfolio exposure
  • Evidence generation that strengthens global value narratives
  • Life cycle value extension from later-launch markets with slower but durable growth

Figure 1

Historical and forecast global prescription sales by region (2021-2027F+)

Image
Historical and forecast global prescription sales by region (2021-2027F+)

Figure 1

Historical and forecast global prescription sales by region (2021-2027F+)

Image
Historical and forecast global prescription sales by region (2021-2027F+)

Globalization and advances in scalable and increasingly advanced digital platforms provide unprecedented opportunities to coordinate and streamline across borders. Yet achieving global launch success remains tricky if local conditions and expertise are not incorporated into global decision-making. In addition, global strategic intent often fails locally when governance is unclear or fragmented and country organizations are insufficiently resourced to execute according to global expectations and guidance.

Five characteristics of best-in-class global launch governance

Drawing on L.E.K. Consulting’s experience with leading biopharma companies, we have identified five governance practices that consistently distinguish high-performing global launches. Together, these practices balance speed, alignment, agility and resilience while maintaining strategic control.

  1. Early strategic alignment
    Effective governance begins by translating the global value proposition into ambitions that resonate locally. Leading companies convene cross-functional, cross-geography workshops 24 to 30 months before first launch to cocreate the product’s value story, define market-specific success metrics and align on a single approach. By involving a country’s medical, market access and commercial leaders early, alignment becomes organic and last-minute rework is largely avoided.
  2. Clear decision rights and accountability
    Ambiguity about “who decides, when and with what authority” remains one of the most common barriers to launch execution. Best-in-class organizations anchor every critical milestone — for example, price corridor approval, health technology assessment (HTA) dossier sign-off and supply allocation — in a rigorously maintained governance matrix supported by a clear escalation ladder. A disciplined decision log, owned by the global launch excellence team and visible across all functions, accelerates decision-making and preserves institutional memory.
  3. Modular launch plans tailored to specific country needs
    Over-customization drives cost inflation, while under customization risks market share loss. High performers segment countries into archetypes such as “HTA-driven innovators,” “private out of pocket” and “tender-centric” and deploy modular playbooks. Core claims, safety narratives and brand assets remain consistent globally, while pricing dossiers, healthcare professional content and advocacy strategies are plug-and-play. This approach balances brand consistency with local adaptability.
  4. Sequenced resources and investment that mirror market readiness
    Affiliates often face near-term profit-and-loss (P&L) pressure that discourages early spending on medical or market access preparation. Leading organizations mitigate this tension through central funding, cost-sharing pools and a single transparent demand forecast enriched with local assumptions. Tiered funding gates, tied to scenario planning, release investments in head count, marketing and supply only when predefined indicators are met. This protects global resources while ensuring priority markets can advance.
  5. Disciplined performance management and course correction
    Governance succeeds only when it can identify risks early and pivot quickly. Monthly cross-functional steering meetings, biweekly functional huddles and milestone-based readiness reviews establish a predictable execution rhythm. Digital dashboards tracking around 25 leading key performance indicators, such as formulary wins, early prescribing breadth and inventory sufficiency, provide real-time visibility. A dedicated project management office (PMO), staffed for at least nine months, enforces adherence, escalates risks and activates predefined “green-yellow-red” playbooks when assumptions shift.

Together, these five characteristics create a governance model that aligns global and local teams, enables agile execution and powers talent. This combination consistently separates launches that outperform forecasts from those that fall short.

Strategic frameworks to tailor level of support

Governance must be flexible enough to reflect both market importance and local resource capacity. A pragmatic 2x2 segmentation, mapping market importance (high vs. low) against resourcing relative to need (well- vs. under-resourced), helps calibrate support (see Figure 2).

Figure 2

Example governance situation needs framework

Image
Example governance situation needs framework

Figure 2

Example governance situation needs framework

Image
Example governance situation needs framework

Market archetypes in action: Tailoring support based on criticality and resourcing

More important/fewer resources: Provide individual resource support

These markets are often in a first or second launch wave but lack local capacity for end-to-end execution. Companies should proactively deploy targeted regional resources to augment affiliate teams.

More important/more resources: Involve early and guide

These markets are typically in the first launch wave and have strong local teams with deep expertise. Strategy should be cocreated early with alignment on life cycle planning and seamless integration of local insights into global decisions.

Less important/fewer resources: Provide cluster support

These are often later-wave markets with limited infrastructure in which a clustered governance model, led by a regional general manager or hub, can manage shared resources efficiently while escalating critical decisions to global teams, emphasizing lean execution.

Less important/more resources: Guide team (to ensure overall alignment)

Though smaller, these markets often have capable local teams and fall in later waves. Global teams should focus on ensuring alignment with value messaging, medical strategy and launch timing.

This framework provides guidance for launch readiness reviews, highlighting mismatches and prompting governance recalibration.

Outlook: Clearer governance will define the next generation of global launches

The path to global launch success is smarter, clearer governance with appropriate resource allocation, not tighter control. Models that enable agile decision-making, build mutual trust and adapt to local needs will outperform those that rely on rigid structures.

As you prepare for global launch execution, consider the following questions as a quick diagnostic. Misalignment in any of these areas may signal the need to reassess your governance approach.

  • Have local market priorities and insights been incorporated into global strategy development?
  • Are decision rights clearly defined and understood across global, regional and affiliate teams and supported by formal governance forums and escalation protocols?
  • Do budget structures allow priority markets to begin launch readiness activities without near-term P&L constraints?
  • Have you assessed markets by archetype and defined which elements of the launch plan must be standardized versus adapted?
  • Are performance indicators, risk signals and readiness milestones tracked consistently through a centralized launch PMO, global launch excellence team and transparent reporting system?

If your answer is uncertain or inconsistent in any area, now is the time to recalibrate. Strong governance is not a back-office function; it is a front-line enabler of global launch success.

For more information, please contact us.

L.E.K. Consulting is a registered trademark of L.E.K. Consulting LLC. All other products and brands mentioned in this document are properties of their respective owners. © 2025 L.E.K. Consulting LLC 

English

Winning the Grocery Race: Strategic Lessons From Global Leaders

October 3, 2025

The grocery sector is at an inflection point. While competition has always been fierce, the sector is now facing an unprecedented level of disruption from challenges including digital acceleration, changing consumer preferences, supply chain shocks and now tariff pressure. From conversations with dozens of executives across North America, Latin America (LATAM), Europe and Asia-Pacific (APAC), L.E.K. Consulting has seen that winners cannot simply react to change but need to anticipate and shape it, setting a new global standard for performance (see Figure 1).

Image
Figure 1: At a glance: Five key findings set the context for every boardroom
Image
Figure 1: At a glance: Five key findings set the context for every boardroom

Taken together, these findings reveal a simple truth: There is no single playbook, but there are transferable lessons. This Executive Insights distills those lessons into pragmatic actions that senior grocery executives, transformation officers and private equity owners can apply regardless of region. The details that follow translate global best practices into local advantages so your organization can win the grocery race before your competitors even get started.

Navigating a fragmented global environment

Key takeaways from our conversations with global leaders provide insight into the opportunities in each focus area for gaining competitive advantage in the current environment (see Figure 2).

Image
Figure 2. Gaining a competitive advantage in the current environment
Image
Figure 2. Gaining a competitive advantage in the current environment

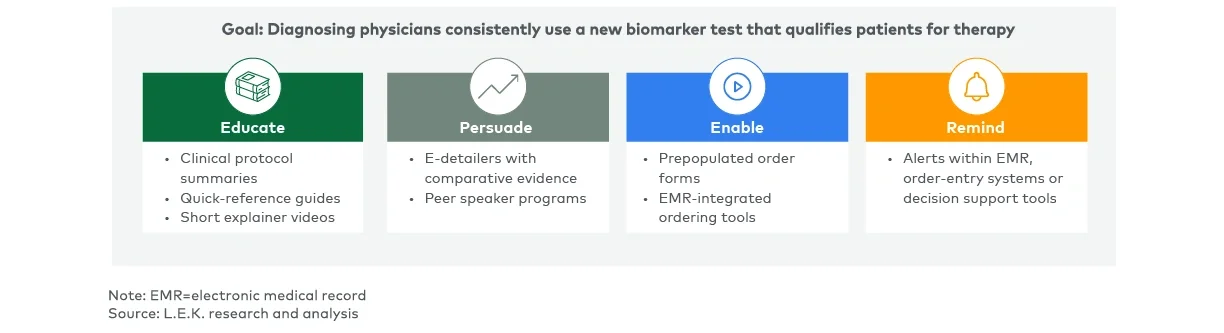
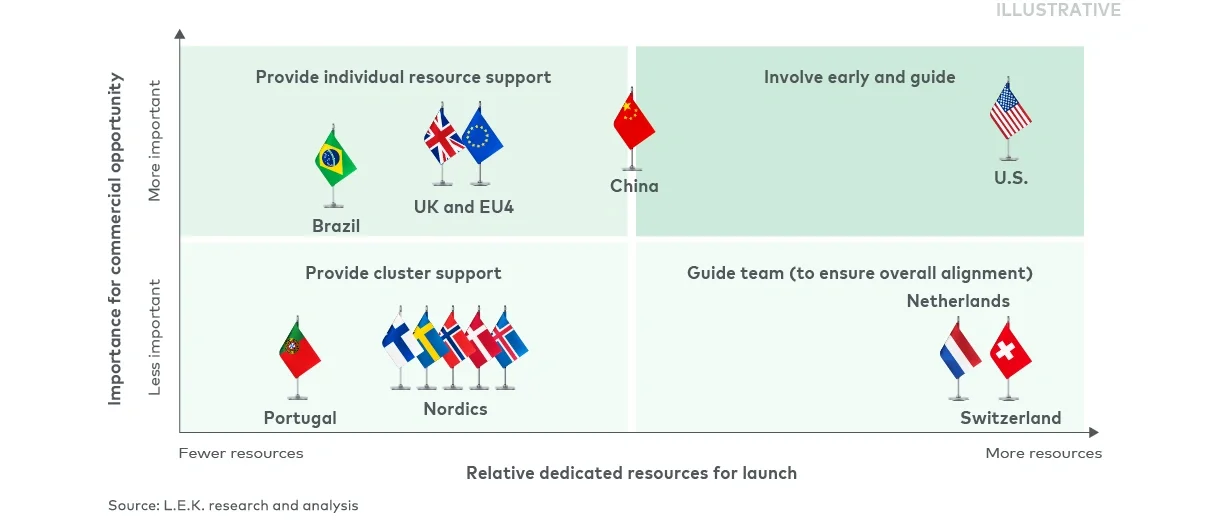
Redefining strategy and operations

Private label

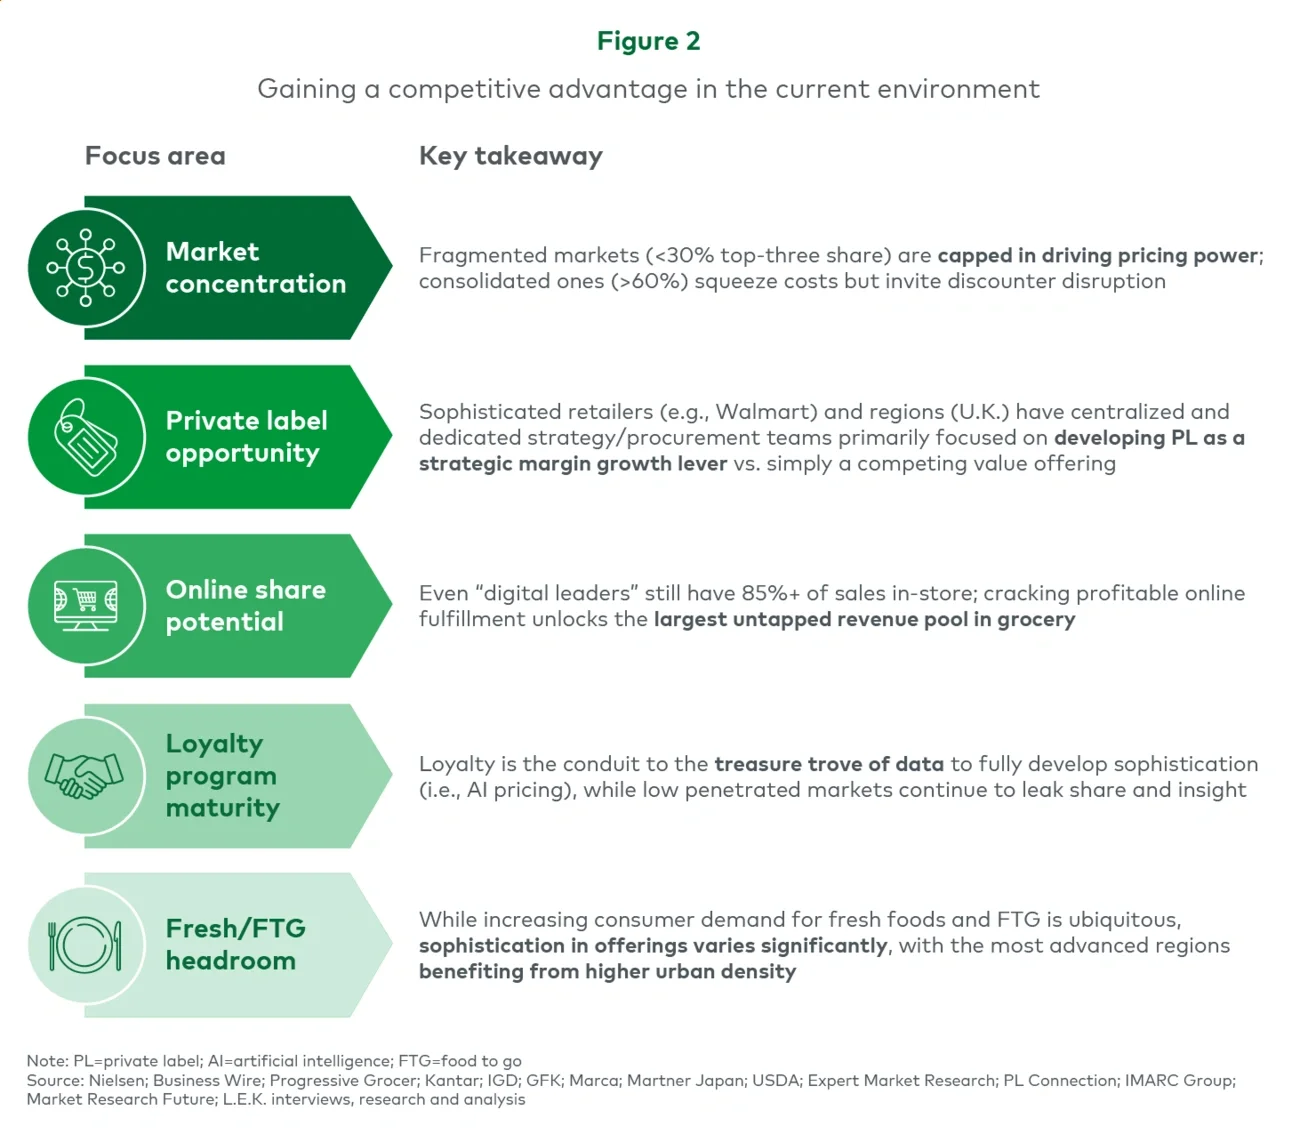
Private label (PL) has evolved from a cost play into a strategic pillar where sophisticated retailers have developed good-better-best tiers within PL that improve margin and build customer loyalty.

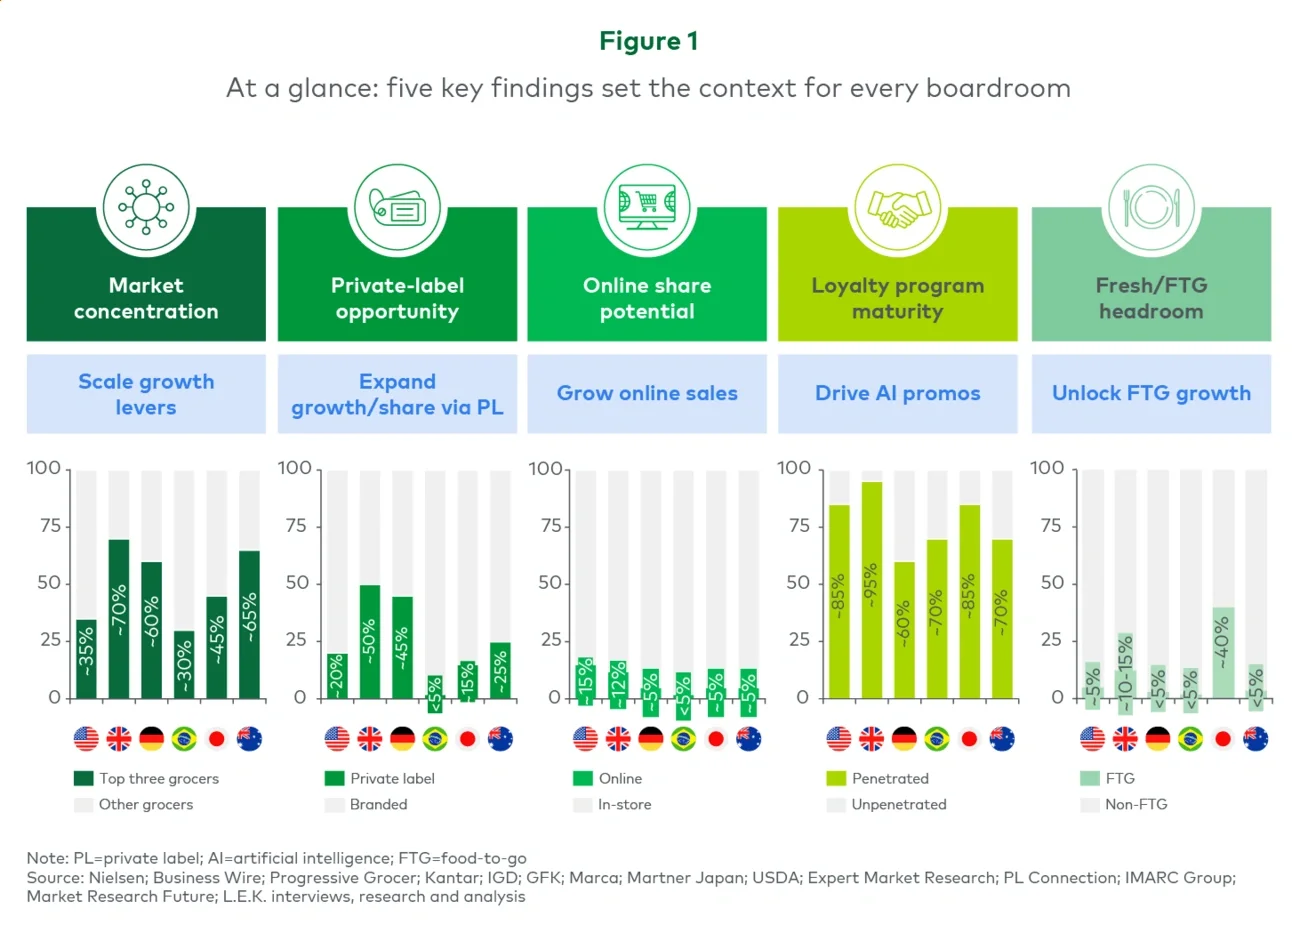
Despite the success retailers model, regional progress on PL varies. On one end, U.K. private label penetration exceeds 50%, Germany is nearing 50% and in Brazil, GPA’s wellness lines are outpacing the market by a factor of two. In contrast, most U.S. grocers lag at approximately 20% penetration, and Coles/Woolworths in Australia is at about 25%, leaving substantial headroom.

Tiered strategies are the benchmark. Tesco’s three-tiered range (Everyday Value, Tesco Own Brand and Tesco Finest) accounts for over 60% of Tesco’s food sales. Sainsbury’s and Loblaw (Canada) deploy similar models that align with shopper budgets while maintaining quality perceptions.

But innovation appears to be the new private label frontier. Costco’s Kirkland Signature has grown into about a $60 billion brand, rivaling top national labels. Metro’s Irresistibles line in Canada has expanded into more than 2,600 stock-keeping units (SKUs) across wellness, gourmet and ethnic cuisines, many of which outperform national brands in quality testing.

Loyalty and personalization

Leading UK grocers such as Tesco and Sainsbury’s have introduced loyalty pricing that acts as a strong value signal against discounters and encourages high loyalty card usage. The richness of data then supports personalized promotions and offers through dedicated apps.

In the U.S., grocers are generally still focused on simpler points-based or cash-back systems with limited personalization.

Store network optimization

Leading grocers are evolving their facilities to meet the distinct demands of their operating environments. Rather than cutting physical footprints, retailers are redistributing space and trying new concepts to better align with urban growth and digital fulfillment needs.

Some are using “urban formats” and microfulfillment centers to boost convenience and last-mile efficiency. Tesco (U.K.; 600-plus Express locations) and Carrefour (France; 1,500-plus Market/City stores) have deployed smaller-format stores that serve as both walk-in locations and click-and-collect hubs. Aeon (Japan) is deploying multistory urban stores with fulfillment centers in the basement that execute under-30-minute delivery in Tokyo’s dense neighborhoods.

And some have created hybrid stores that turn retail into a destination. Carrefour and Aeon have invested in combining grocery with nonfood retail, childcare centers and community clinics to increase trip frequency and deepen consumer loyalty. Carrefour’s “Act for Food” stores in LATAM, for example, are designed around healthier food choices, community space and omnichannel pickup lockers.

Pricing

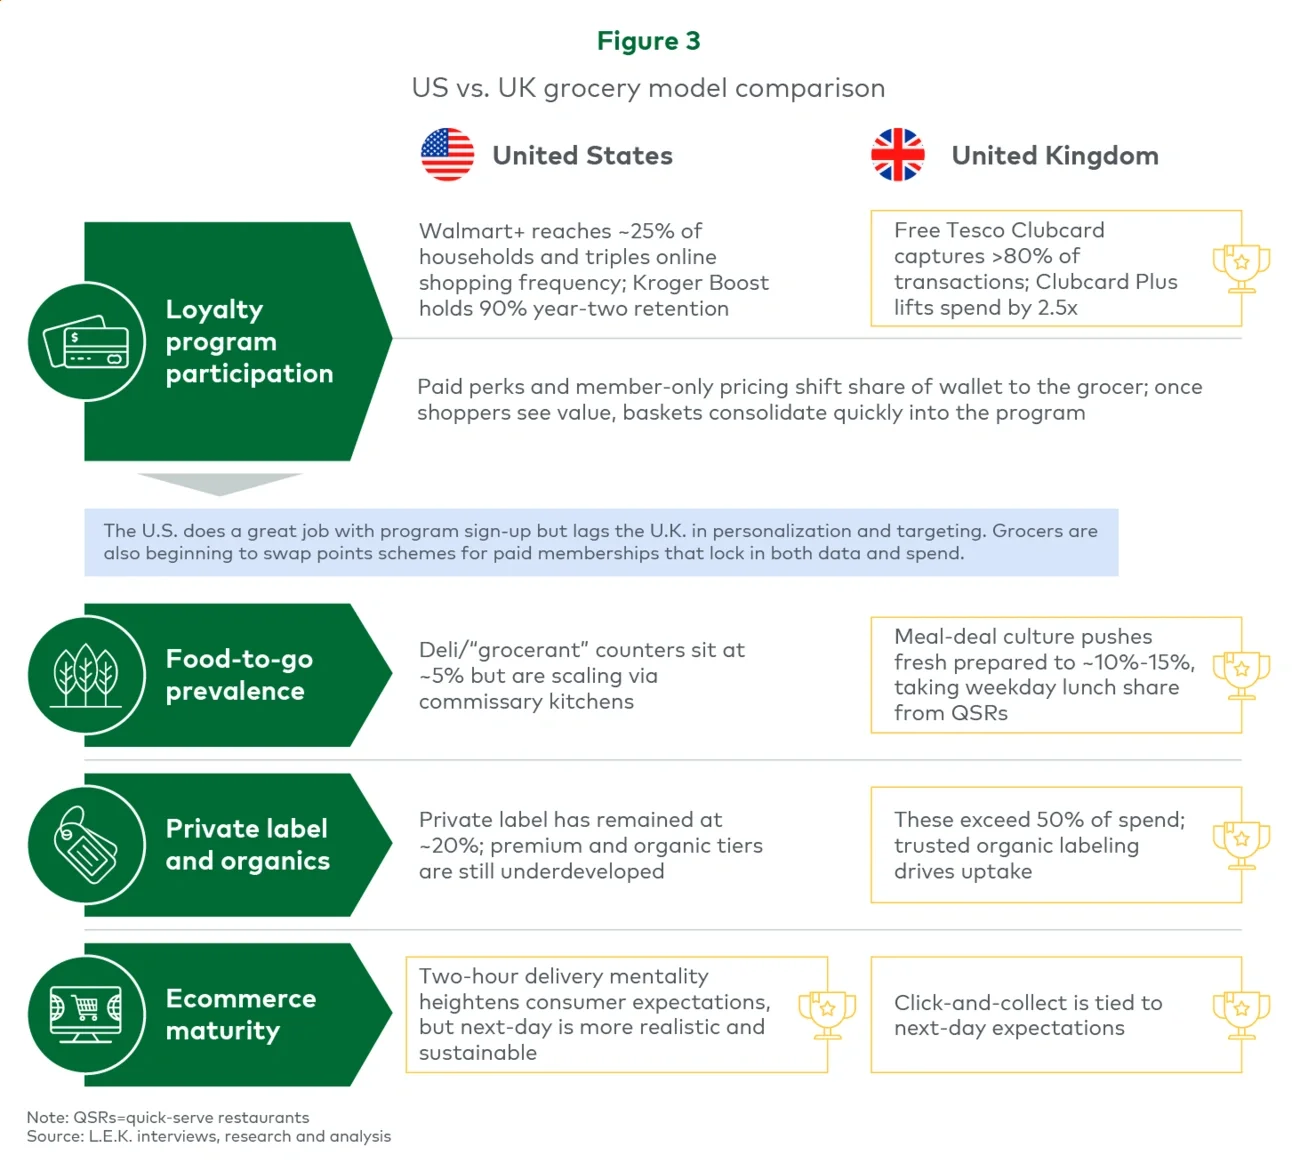
Dynamic pricing driven by artificial intelligence (AI) is no longer experimental; Kroger (U.S.) and Tesco (U.K.) now use these tools at scale to offer personalized promotions that drive higher basket sizes and repeat purchases. Kroger reported in 2023 that households receiving personalized digital offers spent 20% more per trip than nonparticipants.

Meanwhile, Aldi’s and Lidl’s no-frills, transparent pricing structures continue to reshape shopper expectations. In Germany and the U.K., both discounters have gained share steadily over the past decade, now commanding close to 50% combined in Germany and approximately 20% in the U.K. Traditional grocers are being forced to simplify their promotional architecture and win back price-sensitive shoppers with clarity and consistency with their offers

Product offering insights: Vary levels of standards

Frozen vs. fresh

Japan’s leadership in frozen food, explored previously in L.E.K.’s 2023 prepared foods insight, challenges the Western perception that frozen equals inferior. Aeon’s dedicated @Frozen stores stock more than 2,000 SKUs, including sushi-grade fish, gourmet pasta and artisanal desserts. 7-Eleven Japan delivers frozen, chilled and ambient-temperature goods through separate daily routes, enabling fresh-like quality with frozen convenience.

While penetration in the U.S. of frozen food is not that low, sophistication and frequency of use lags most advanced markets by far. In the U.S., frozen food categories grew about 8.5% in 2023, according to IRI, as inflation pushed shoppers toward longer shelf life and meal-prep ease.

U.S. grocers continue to lag in fresh shrink optimization efforts. Marks & Spencer in the U.K., by contrast, uses predictive markdown algorithms to reduce fresh waste by more than 20%.

Packaged goods

Approaches to product selection vary by region, with varying consequences. In the U.S. and Canada, grocers often carry more than 40,000 SKUs per store. While providing customer choice, this complexity drives costs higher and diffuses value messaging.

U.K. grocers are moving in the opposite direction and reducing SKUs by 20%-30% in many categories in order to focus on high-velocity and private label items. Tesco reports improved inventory turnover and better supplier negotiation leverage as a result.

In LATAM and APAC, assortment curation is becoming a competitive differentiator, particularly in smaller formats targeting urban shoppers.

Nonfood products and services

Leading U.S. stores are attracting new traffic and increasing dwell time through nonfood and service offerings; e.g., Walmart’s health centers and Kroger’s in-store clinics. Pharmacy sales are also a key footfall driver in competitive U.S. markets.

China’s Hema stores have a second function as logistics hubs, processing more than 50% of orders online, with many fulfilled in under 30 minutes. This level of integration drives basket expansion and blurs the line between retail and fulfillment.

Spotlight on US vs. UK: A tale of two grocery models

A comparison of the largest market (U.S.) with the global grocery leader (U.K.) showcases clear growth areas for the U.S. (see Figure 3).

Image
Figure 3. US vs UK grocery model comparison
Image
Figure 3. US vs UK grocery model comparison

In summary: Strategic imperatives to future-fit grocery retailers 

Grocery used to be slow-moving and about scale, but it is now high-frequency and about precision across data, formats and value propositions. 

  1. Commit to private label
    Make PL core, not complementary. Materially drive penetration in North America; develop a tiered, innovation-forward range to drive margin, loyalty and brand differentiation.
  2. Design loyalty 2.0
    Explore levers like loyalty pricing, personalization and PL exclusives; target more than 50% of sales through identified members by 2027.
  3. Exploit microfulfillment
    Order picking in less than an hour can slash online unit cost by 30%-40%; fund via SKU rationalization capex release.
  4. Monetize fresh-prepared foods
    Even just shifting fresh-to-go’s share from 5% to 8% in the U.S. would add more than $25 billion in category dollars; learn from Japan’s logistics “day-parts” model.
  5. Modernize the model
    AI, automation and microfulfillment are no longer optional. Invest now or risk irrelevance as we have noted here.

Winners will localize global ideas faster than rivals can copy them. At L.E.K., we help clients translate global insights to localize with intent: we don’t just copy global best practices but tailor them to your structural realities and turn complexity into competitive advantage. The race is on. Let’s run it together.

For more information, please contact us.
 

L.E.K. Consulting is a registered trademark of L.E.K. Consulting. All other products and brands mentioned in this document are properties of their respective owners. © 2025 L.E.K. Consulting

English

Dubai: A Global Hotspot for Higher Education

September 29, 2025

Our Global Education Practice hosted an exclusive higher education breakfast briefing in Dubai, bringing together senior stakeholders from academia, investment and government, including key representatives from the Knowledge & Human Development Authority. 

The event provided a platform for insightful discussions on Dubai’s rapidly evolving higher education landscape, its emergence as a global hub and the strategic developments shaping the sector. 

Watch the highlights from the event.

L.E.K. Consulting is a registered trademark of L.E.K. Consulting LLC. All other products and brands mentioned in this document are properties of their respective owners. © 2025 L.E.K. Consulting LLC

English

Navigating Medtech Volume-Based Procurement in China

September 29, 2025

China’s Volume-Based Procurement (VBP) program has reshaped the medtech landscape, driving price cuts of 60 %–90 % across many device categories after five years in force.

In this video briefing, L.E.K. Partner Grace Wang distils what comes next for manufacturers — from capturing rapid hospital uptake and pivoting to premium portfolios to redesigning channels and influencing tender rules.

Watch the video to hear Grace’s practical guidance on defending value and seizing growth in post-VBP China.

L.E.K. Consulting is a registered trademark of L.E.K. Consulting LLC. All other products and brands mentioned in this document are properties of their respective owners. © 2025 L.E.K. Consulting LLC

English
Subscribe to