Executive Insights

A Bifurcated Lab Market Is Reshaping Strategic Priorities and Capital Decisions

Insights from L.E.K.’s US Clinical Diagnostic Lab Survey (2025)
February 27, 2026

Key takeaways

Clinical diagnostic labs are bifurcated in economic health, with roughly half reporting being well positioned and half feeling financially constrained; this sentiment is consistent across all major lab types (AMCs, large community hospital labs, small/midsize community hospital labs and reference labs).

Major strategic priorities among labs center on driving operational discipline, including cost efficiency and revenue cycle management, while many financially well-positioned labs are also seeking to expand capacity and access new diagnostic technology.

Financially well-positioned labs are anticipating stronger revenue growth in the near term, suggesting the gap in financial health may widen.

In a sector increasingly split between labs that can invest selectively and those operating under constraints, IVD manufacturers should focus on tailoring value propositions to distinct customer realities and delivering tangible operational and financial outcomes.

Clinical diagnostic labs enter 2026 with steady demand and continued menu evolution. At the same time, reimbursement pressure, labor constraints and heightened capital scrutiny are reinforcing a disciplined proof-of-value posture, with spend driven by measurable operational and financial benefit.

L.E.K.’s U.S. Clinical Diagnostic Lab Survey captures perspectives from 100 executives and directors of hospital and multispecialty commercial labs to assess financial health, outlook, and strategic priorities, and to anticipate how demand signals and spending patterns may evolve.

In this edition of L.E.K. Consulting’s Executive Insights, we highlight four themes shaping 2026-2028 investment decisions and discuss the implications for diagnostics original equipment manufacturers (OEMs) and lab suppliers.

Four dynamics shaping 2026-2028 investment decisions

1. There is a bifurcation in financial health, regardless of lab setting

Roughly 40%-50% of labs describe themselves as well positioned (solid/improving or strategically strong), while 50%-60% report being constrained or at heightened financial risk (see Figure 1).

Figure 1

Financial health, by lab type

Image
Figure 1 represents financial health, by lab type

Figure 1

Financial health, by lab type

Image
Figure 1 represents financial health, by lab type

Notably, this split appears broadly consistent across academic medical centers (AMCs), community hospitals and reference labs, with no clear pattern tied to lab size or modality mix, pointing to broad structural pressures rather than challenges isolated to specific segments. On the other hand, lab financial health appears to vary regionally, with approximately 50% of labs in the South and West reporting being financially well positioned compared with about 25% in the Northeast and Midwest. This may partly reflect faster population growth and higher chronic care demand in the South and West regions.

2. Revenue outlook is positive, but well-positioned labs expect to outpace constrained peers

Financially well-positioned labs have a positive revenue growth outlook, with nearly 60% expecting 5%+ annual increases and another 35% expecting 1%-4% annual increases (see Figure 2). Financially constrained labs, in contrast, are less optimistic, with around 35% expecting flat or decreasing revenue and another roughly 35% expecting modest 1%-4% annual increases, suggesting that topline expansion may not be sufficient to offset structural cost inflation or meaningfully expand operating flexibility for these labs. The differential between well-positioned and constrained labs also suggests that the divergence could expand as the overall market grows, with stronger labs better positioned to reinvest in capacity, menu and technology expansion than their constrained peers.

Figure 2

Expected annual total test revenue change in the next three years, by lab financial health

Image
Figure 2 represents expected annual total test revenue change in the next three years, by lab financial health

Figure 2

Expected annual total test revenue change in the next three years, by lab financial health

Image
Figure 2 represents expected annual total test revenue change in the next three years, by lab financial health

AMCs and reference labs express greater optimism than community hospital labs in expected revenue growth, with 45%-60% of experts from AMCs/reference labs projecting 5%+ annual revenue growth over the next three years versus 25%-40% among community hospital labs. Notably, approximately 15% of labs expect a revenue decline over the next three years, mostly in hospital labs.

Even with expected revenue growth, capital budgets are largely expected to be flat or only modestly up. Across lab segments, the majority of respondents (roughly 60%) anticipate no change or only slight increases (<5%) in annual capital budgets for new or upgraded equipment over the next three years, signaling conservatism in near-term instrumentation spend outside of reagent rental models.

3. Strategic priorities converge on operating discipline, with divergence on growth versus resilience

Across financial cohorts, labs’ near-term priorities are anchored on operational discipline. Improving operational and cost efficiency and improving revenue capture/revenue cycle management sit at the top of the agenda for both constrained and financially strong labs (see Figure 3). Workforce challenges also remain a pervasive operational bottleneck for both constrained and well-positioned systems.

Figure 3

Current lab strategic priorities, by lab financial status

Image
Figure 3 represents current lab strategic priorities, by lab financial status

Figure 3

Current lab strategic priorities, by lab financial status

Image
Figure 3 represents current lab strategic priorities, by lab financial status

Where priorities diverge are in second-tier actions that signal the ability to invest versus the need to defend. Financially strong labs place materially greater emphasis on expanding capacity and lab footprint as well as securing access to new diagnostic technology, reflecting a posture that extends beyond stabilization into selective growth and modernization. In contrast, constrained labs place materially higher emphasis on supply chain and inventory management (51% vs. 32%), consistent with limited tolerance for shortages, price volatility and backorders that can disrupt service and revenue capture.

Although embedding artificial intelligence (AI) into operations ranks lower among stated strategic priorities, many labs are already deploying it selectively to drive efficiency. About 60% of surveyed labs report at least trialing AI in selected workflows, led by reference labs (approximately 70%) and large community hospitals (roughly 65%), followed by AMCs (about 55%) and small community hospitals (around 45%). AI adoption today is concentrated in analytical workflows/ test interpretation and result reporting and delivery.

Looking ahead, roughly 90% of experts expect broader AI use within three years, with expanding applications including quality control and specimen triage and prioritization. Wider adoption of AI will depend on demonstrating clear operational return on investment (ROI) and directly supporting top lab strategic priorities, particularly efficiency gains and revenue capture.

Notably, the survey also indicates that strategic priorities are broadly consistent across lab settings and lab sizes, underscoring that the emphasis on productivity and efficiency is consistent across labs in AMCs, community hospitals and reference environments.

Implications for in vitro diagnostics manufacturers: How to win in a bifurcated market

As purchasing decisions place greater emphasis on demonstrated ROI and ease of execution, suppliers will increasingly need to meet labs where they are — recognizing that a one-size-fits-all value proposition will not resonate equally with financially strong and financially constrained labs.

The following implications summarize how OEMs and lab suppliers can win in this environment:

  1. Tailor the value proposition by financial posture. Financially strong labs are more likely to prioritize modernization and selective growth, whereas constrained labs will be more focused on near-term stabilization and resilience; suppliers should segment messaging, offerings and commercial approaches accordingly.
  2. Lead with quantified operational and economic outcomes. Labs’ “table stakes” increasingly emphasize demonstrable impact over general claims — suppliers should translate solutions (including end-to-end automations) into measurable improvements in key lab outcomes (e.g., throughput, turnaround time, utilization, first-pass yield, labor productivity, revenue capture/denials) and articulate the economic value clearly.
  3. Reduce adoption friction through execution support. Given staffing constraints and limited tolerance for disruption, implementation capabilities (workflow design, training, information technology/connectivity, change management, service models with guaranteed uptime, remote monitoring) increasingly influence purchase decisions alongside product performance.

Conclusion

Our 2025 Clinical Diagnostic Lab Survey depicts a sector increasingly split between labs that can invest selectively and those operating under meaningful constraint. Most labs expect revenue growth through 2028, but stronger labs anticipate faster growth, potentially reinforcing divergence. For OEMs and suppliers, success will depend on tailoring value propositions to distinct customer realities, delivering quantified operational and financial outcomes, and providing robust execution support.

In an upcoming edition of Executive Insights, we will explore how test demand is growing across key modalities, how labs are adopting emerging technology platforms including next-generation sequencing and digital pathology, and more.

To discuss these findings and how your organization can position itself for success in this evolving environment, please contact us.

Note: AI was used to support the drafting of this article.

L.E.K. Consulting is a registered trademark of L.E.K. Consulting LLC. All other products and brands mentioned in this document are properties of their respective owners. © 2026 L.E.K. Consulting LLC

English

Personalized Care at Scale: The Growing Impact of Functional Medicine

February 27, 2026

Functional medicine is rapidly gaining momentum as patients, providers, and investors look for more personalized, preventative, and outcomes-driven models of care. In this panel discussion, Rozy Vig, Ph.D., Managing Director in Healthcare Services at LEK Consulting, moderates a conversation on how functional medicine is evolving from a niche approach into a scalable, technology-enabled, and increasingly investable segment of the healthcare ecosystem.

Rozy is joined by Chris Dorn, Managing Director of HCIT at Fifth Third Securities, who brings an investor and deal-making perspective; Tom Blue, Founding Partner at Ovation Lab, a longtime leader in functional, integrative, and longevity medicine strategy; and Ryan Obermeier, Chief Commercial Officer of Evexia Diagnostics, who offers deep operational insight into the diagnostic infrastructure supporting functional medicine practices. Together, the panel explores what’s driving growth, where challenges remain, and how innovation, data, and AI may shape the next phase of the market.

“Functional medicine is fundamentally about looking beyond symptoms and asking what the underlying cause really is; it’s how we solve problems everywhere else in life, and it’s finally arrived in healthcare.” Tom Blue

“We’re still in the early innings, but interest from investors, providers, and consumers has accelerated dramatically over the past few years.”Chris Dorn

English

Reinventing Value Creation in Medtech CDMO: A Smarter Playbook for PE Exits

February 26, 2026

As the medtech contract development and manufacturing organization (CDMO) market matures, private equity (PE) investors are finding that scale alone no longer guarantees optimal valuation. Increased competition, integration risk and diminishing arbitrage have shifted the value creation imperative from aggregation to optimization. At L.E.K. Consulting, we see forward-looking sponsors asking a sharper question: How do we build an asset that is designed for a better exit from day one?

Our answer: a deliberate, multidimensional value creation strategy supported by operational discipline, commercial excellence and a robust, proactive “exit checklist” that transforms portfolio companies from good businesses into exit-ready platforms.

CDMO exit checklist: What maximizes valuation?

While not comprehensive, the following components are often key pillars of a value creation plan and can vary widely for specific medtech CDMOs depending on the historical context, management vision and roadmap.

  • Commercial optimization
    • End market mix: Portfolio exposure to higher-growth markets and resulting weighted average market growth rate (WAMGR)
    • Customer mix and distribution: Diversified, strategic relationships
    • Commercial sophistication: Proven ability to acquire and grow strategic accounts (e.g., clear roles, aligned incentives, rigorous sales tools/processes, diversified pipeline)
    • Geographic footprint: Aligned geographically with original equipment manufacturer (OEM) supply chains, providing resiliency and cost effectiveness
  • Operational optimization
    • EBITDA margins and trajectory: Clear and credible margin story at or above peer average
    • Product and service offerings: Full-service capabilities across preproduction, production and postproduction; internally integrated for effective handoffs and cross-selling
    • Technical capabilities: Demonstrated depth of technical expertise
    • Compliance and scalability: Quality systems and infrastructure designed to scale

The waning effectiveness of the traditional rollup model

While there is still plenty of room for consolidation, the market is increasingly crowded and multiple expansions and arbitrage can no longer be relied upon as a primary source of value creation. All this results in the increased importance of a proactive exit checklist to create incremental value. Value creation plans are not a new concept, but the confluence of macroeconomic trends (e.g., supply chain disruption, inflation, tariffs), CDMO consolidation and added complexity, and evolving medtech OEM priorities (e.g., return to margin, segment focus, destocking, new launches) have added complication to historical value creation playbooks.

A smarter value creation approach: Beyond the basics

To deliver outsized returns, PE sponsors must encourage management teams to mature from episodic initiatives to a multidimensional, ongoing value creation model. A clear strategic value creation vision should be ready early in the investment hold period (optimally from day one) and should be designed with the exit in mind. Below is a selection of value creation pillars L.E.K. regularly leverages to support medtech CDMO value creation.

Exit checklist: Example commercial optimization pillars

Growth strategy in the core markets and customers we know well versus the adjacent markets and customers we should expand into:

  • WAMGR-driven prioritization: Are we in the right end markets?
  • Customer segmentation and white space mapping: Are we active with the right customers? Are we reaching their correct divisions? Said differently, is our CDMO “winning with the winners”?
  • Geographic expansion strategy aligned with regulatory capabilities: Where can we go next?
  • Technical adjacency strategy: What technical capabilities should we add next? What new programs, new parts of current programs, new customers or new markets might that position us for? Do we have differentiated technical capabilities for mission-critical parts or key bottlenecks in the supply chain?

Commercial excellence in an increasingly sophisticated medtech CDMO market:

  • Go-to-market (GTM) model design for new services or geographies: Is our GTM model (channels, coverage, partnerships, pricing and support model) fit for purpose for the priority target customer segments?
  • Sales force effectiveness and account targeting: Are our reps targeting the right platforms at the right OEMs at the right time?
  • Business development: How concentrated or diversified is our pipeline by product/platform, by OEM customer and by market? Are we landing and expanding across decentralized OEMs effectively?
  • Key account management and pricing discipline: Are we treating all customers equally? Do we have a structured tiering to balance resource utilization and return with our key customers? Are we giving white-glove service to those customers that deserve it?
  • Talent: Do we have the right mix of sales talent to balance “hunting” and “farming” expectations?
  • Commercial enablers: Does the organization have the right tools, processes and enabling functions in place to effectively and efficiently target and convert priority customers?

Pricing strategy in what has historically been a “cost plus” environment that leaves value on the table:

  • Margin value capture: Are we capturing the value we are creating (especially in mission-critical applications or complex device programs)?
  • Contract architecture (volume tiers, inflation pass-throughs): How do we protect ourselves against cost, inflation and tariff uncertainty?
  • Pricing processes: Are we limiting our financial returns due to process, people and tool limitations when quoting business?

Exit checklist: Example operational optimization pillars

Margin levers and scalability

  • Cost structure: What are the largest cost drivers that could be optimized through various mechanisms (e.g., automation, computer vision quality inspections, procurement, use of artificial intelligence in back-office functions)?
  • Facility readiness (i.e., capacity, throughput, downtime): Are we buying an asset that can keep up with demand in priority markets, especially high-growth markets (e.g., the pulse field ablation revolution in electrophysiology)?
  • Quality systems’ robustness and regulatory risk: How sophisticated is the asset in managing quality and regulatory risks?
  • Scalability of standard operating procedures, enterprise resource planning (ERP) and workforce capabilities: How hard will it be to find, train and retain requisite skilled labor to scale the business?
  • Operational competitiveness: How do our roles, resourcing, key performance indicators and ways of working stack up to the competition’s?

Capability/asset integration

  • Functional integration (e.g., finance, quality assurance, supply chain roadmaps): What is essential for day one? How do we ensure no deterioration of out-of-tolerance or failure rates? How do we capitalize on improved buying leverage with key vendors?
  • System and process harmonization (e.g., ERP, manufacturing execution system, quality management system): Where, if at all, do we harmonize with other existing businesses?
  • Cultural alignment and leadership continuity: How can we proactively address cultural friction that could lead to loss of key engineering or sales talent, and do we have the right leadership for the long term?
  • Synergy-capture tracking and governance: How do we deliver and diligently track the synergies identified (e.g., general and administrative, work transfers that enable right-sizing capacity or labor efficiencies, capabilities cross-sell)?

Conclusion: Designing for exit from day one

The playbook is changing. Scale alone no longer commands premium valuation. Today’s buyers want operational maturity, growth potential and defensible commercial strength. By embedding structured diligence, a strong integration capability and targeted value creation levers early in the hold period, PE sponsors can create assets that are not only scalable but also prepared for a more optimal exit from the beginning of the holding period.

L.E.K. brings the sector insight, toolkits and rigor to help medtech investors transform good assets into great exits.

For more information, please contact us.

L.E.K. Consulting is a registered trademark of L.E.K. Consulting LLC. All other products and brands mentioned in this document are properties of their respective owners. © 2026 L.E.K. Consulting LLC

English

AI Breaks Out: From Pilot Projects to Energy’s Digital Engine

February 27, 2026

Artificial intelligence (AI) is gaining real traction within operations across the energy sector. Limited trials have given way to broader deployment, and it is becoming a part of how utilities and oil and gas (O&G) operators manage commercial growth, reliability, risk, cost and system planning. L.E.K.’s 2025 Global Energy Study captures this shift clearly.

Adoption is increasing across the value chain, though progress is uneven and often held back by data limitations and organizational hurdles. Even so, companies remain committed to strengthening the foundations required for reliable, scaled use.

About the survey

Our 2025 Global Energy Study — the firm’s seventh energy annual survey — captures perspectives from more than 300 senior executives across oil and gas, utilities, and renewables, complemented by over 25 in-depth interviews with industry leaders.

Respondents represent companies with revenues above $50 million and at least five years of industry experience, spanning North America, Europe, the Middle East, Asia-Pacific, Australia/New Zealand, Latin America and Africa.

This year’s study continues to explore capital investment expectations and drivers while introducing two new focus areas: the evolving role of natural gas and the adoption of AI in the energy sector.

AI adoption is expanding into high-value workflows

Viewed through L.E.K.’s AI Delta lens, AI use cases typically fall into three categories: performance (driving efficiency, reliability and cost reduction), competitiveness (improving decision quality and commercial outcomes), and differentiation (enabling new business models and revenue streams). Today, energy companies are deploying AI most actively in performance use cases, with selective progress in competitiveness applications and more limited adoption of differentiation-driven models. This pattern reflects a sector focused on reliability and near-term value creation as it moves from pilot activity toward broader, scaled use.

Utilities are taking the lead in operational AI. Survey data shows that 62% use AI for energy-demand forecasting, helping operators anticipate load more accurately during periods of rising electrification. Fifty-three percent use predictive maintenance and asset monitoring tools, which aid early identification of equipment risks and reduce unplanned outages.

Utility adoption extends beyond system operations. Forty-eight percent apply AI to customer experience and service management. A smaller share deploy AI in supply chain and procurement functions, reflecting slower data standardization in those areas. These patterns signal steady movement toward broader digital operations, with a clear priority placed on applications that strengthen reliability.

O&G companies show a distinct pattern. More than half rely on AI for market-sentiment modeling and performance analytics. These tools support trading, planning and operational scheduling. Additional use cases include inventory optimization, supplier-risk analytics, anomaly detection and real-time drilling support. Uptake varies widely across these applications, with analytical functions seeing higher adoption than field-level automation.

Together, these results show that AI is taking on a more central role. Usage is rising where data volume is sufficient and where the link between model output and operational efficiencies is direct (see Figure 1).

Image
Figure 1 represents prevalence of AI usage
Image
Figure 1 represents prevalence of AI usage

Scaling hinges on data readiness and process integration

AI expansion brings operational constraints. Survey respondents identify three barriers more often than others: data quality limitations, workflow integration challenges, and governance gaps around ownership and oversight. These issues appear across both utilities and oil and gas firms.

Implementation difficulties are cited most frequently, with more than one-quarter calling them the clearest bottleneck. Executives describe cases where model accuracy is strong but integration into existing workflows remains incomplete. Others highlight inconsistent data availability or insufficient feedback loops for model refinement. These challenges limit AI’s reliability in production environments.

Importantly, these constraints are less about the underlying technology and more about organizational readiness. As seen across other asset-intensive industries, the majority of AI value creation depends on process integration, data quality and operating-model alignment rather than model performance alone. Without clear ownership, redesigned workflows and consistent governance, even technically robust AI solutions struggle to deliver repeatable impact at scale.

Companies are addressing these issues through infrastructure upgrades and more structured approaches to deployment. More than half identify IT system modernization and data platform improvements as top priorities. Many are also advancing initiatives to clarify governance, improve data hygiene, and ensure alignment between digital teams and operational leaders.

The study’s interviews reinforce this picture, as leaders point to a real need for standardized inputs and clearer accountability. These steps determine whether AI contributes consistently to operational or commercial results.

Return on investment remains difficult to capture, yet long-term confidence is strong

Executives express a mix of caution and confidence when evaluating AI’s current value. Some rely on AI in limited settings, while others apply it broadly yet struggle to quantify the impact. Data fragmentation and incomplete integration are some of the biggest roadblocks which continue to inhibit performance.

The long-term view is markedly more optimistic than the current assessment. While only 49% of utilities and 44% of O&G respondents believe their organizations are fully realizing AI’s value today, that figure rises to 83% and 78%, respectively, when looking ahead 10 years. This gap highlights a consistent pattern across the sector: Leaders recognize that meaningful value has yet to be captured at scale, but remain confident that the underlying opportunity is substantial (see Figure 2).

Image
Figure 2 represents AI value realization: current vs 10-year outlook
Image
Figure 2 represents AI value realization: current vs 10-year outlook

Segment-specific trajectories are taking shape

Utilities: Strengthening system intelligence

Utilities rely on AI to improve forecasting accuracy, enhance asset visibility and support outage management. These applications help operators manage load variability and rising levels of distributed generation. AI adoption is also growing in customer-facing tasks, especially those that benefit from real-time service data. Utilities remain cautious about more advanced operational applications, reflecting the need for stable data foundations.

O&G: Deepening use of analytics and optimization

O&G companies emphasize commercial and analytical use cases. Market models, performance analytics and inventory optimization tools are among the most common applications today. More advanced operational capabilities such as virtual flow metering or real-time drilling optimization show lower penetration but rising interest. Adoption is accelerating in areas with clear links to cost reduction and risk management.

This trajectory helps explain why O&G executives express particularly strong confidence in AI’s long-term impact. A significant majority believe AI will materially reshape O&G networks over the next decade, reflecting the breadth of potential applications across upstream, midstream and downstream operations. Each segment is building AI maturity through applications aligned with its operational priorities (see Figure 3).

Image
Figure 3 represents transformative potential of AI
Image
Figure 3 represents transformative potential of AI

AI is becoming an integral part of how energy companies run their systems. Future progress depends on stable data, coherent governance, closer integration between technical and operational teams, and consistent deployment through the workflow.  Together, these factors increasingly determine whether AI remains a collection of pilots or becomes a durable engine of operational and commercial value.

This article concludes our Powering Forward series which examines the realities of the energy transition in 2025.

Across the series, we explore how energy leaders are recalibrating capital allocation, strengthening grid resilience and embedding AI into core operations.

Explore the full series:

How L.E.K. can help

Our teams advise energy leaders on where to invest, how to build the data, process and operating foundations for AI at scale,and when to accelerate transition bets. Our 2025 Global Energy Study provides the data and insight and our consulting expertise helps clients translate these findings into decisions that create value today and secure a position for tomorrow.

For more details on the full study or to learn how these insights apply to your business, please contact our global energy team.

L.E.K. Consulting is a registered trademark of L.E.K. Consulting LLC. All other products and brands mentioned in this document are properties of their respective owners. © 2026 L.E.K. Consulting LLC

English

Gridlock or Go? Why Grid Resilience Is the New Bottom Line

February 27, 2026

Electricity networks are quickly becoming the defining constraint of the energy ecosystem. The network was not built for today’s demand profile, and it shows. Surging electrification and industrial load growth, coupled with unprecedented data center expansion, are stretching grids that were already under pressure from aging assets and unpredictable weather.

The result is a structural mismatch. Demand is accelerating faster than grid reinforcement can keep pace, and utilities are now reorienting capital programs in an attempt to respond. L.E.K.’s 2025 Global Energy Study reveals a sector moving urgently to protect the backbone of modern energy systems, with grid readiness becoming as important as generation itself.

About the survey

Our 2025 Global Energy Study — the firm’s seventh annual survey — captures perspectives from more than 300 senior executives across oil and gas, utilities, and renewables, complemented by over 25 in-depth interviews with industry leaders.

Respondents represent companies with revenues above $50 million and at least five years of industry experience, spanning North America, Europe, the Middle East, Asia-Pacific, Australia/New Zealand, Latin America and Africa.

This year’s study continues to explore capital investment expectations and drivers while introducing two new focus areas: the evolving role of natural gas and the adoption of artificial intelligence in the energy sector.

A demand surge the grid cannot ignore

Executives across the power sector describe a common challenge: Growth is arriving faster than the network can respond. U.S. utilities report multiyear load increases driven by hyperscale data centers and industrial expansion. Dominion Energy, for example, expects 6%-7% annual growth in Northern Virginia in contrast to a historically flatter demand profile.

In Europe, demand growth is less concentrated but still rising, driven by electrification and data-intensive infrastructure, placing sustained pressure on networks even where year-on-year increases are more modest. In the UK, the National Energy System Operator (NESO) expects electricity demand to rise steadily through the 2030s, reversing decades of flat consumption.

This surge in consumption requires large-scale reinforcement. Duke Energy allocates roughly half of its five-year plan to modernization, grid hardening and substation upgrades. European utilities are prioritizing digitalization and network intelligence to integrate renewables, electric vehicles and battery projects efficiently.

The message is consistent across regions: Demand growth is structural, and grid strength is now a prerequisite for system reliability.

Grid modernization is the priority

L.E.K.’s survey data reinforces this direction. Most utilities are investing in grid modernization, alongside backup or dispatchable power, reflecting a recognition that capacity constraints and intermittent generation cannot be resolved through new supply alone.

Transmission and distribution (T&D) dominate near-term investment priorities. Utilities rank T&D network upgrades as their most likely area of investment, well ahead of new generation technologies (see Figure 1). Modernization efforts include the reinforcement of substations and lines, storm hardening, the use of smart devices, cybersecurity improvements and the integration of battery storage.

This represents a decisive turn from a generation-led transition to a grid-first approach. Executives are making clear that system flexibility and resilience must underpin any credible decarbonization pathway.

Image
Figure 1 represents utilities’ top investment priorities for the next five years
Image
Figure 1 represents utilities’ top investment priorities for the next five years

The data center effect: A new reliability stress test

The exponential rise in data center demand is intensifying pressure on already-constrained grids. Utilities report multigigawatt clusters requiring near-continuous power and full redundancy. Survey responses confirm a growing dependence on temporary behind-the-meter (BTM) solutions as interconnection queues and equipment bottlenecks slow grid access (see Figure 2).

This is consistent with our recent client engagements, which indicate that BTM use for data centers is set to more than double between 2026 and 2030 as operators seek reliable, controllable power sources. The trend is also mirrored in our study, with 63% of oil and gas respondents that lack confidence in the grid now adopting BTM solutions to maintain project certainty.

Image
Figure 2 represents expected share of data center/ large-load megawatts to be powered by BTM solutions
Image
Figure 2 represents expected share of data center/ large-load megawatts to be powered by BTM solutions

This creates a two-speed system: Grid upgrades take years; data centers scale in months. BTM generation provides a bridge for operators, but companies consider it a short-term workaround of less than two years rather than a structural solution. The long-term answer remains the same across the board: grid capacity, reinforced and modernized to handle both daily load and future growth.

A new reliability equation for renewables and gas

The growing share of renewables has brought valuable generation diversity, but it has also raised concerns about firm capacity. Our survey reveals that 59% of utilities believe renewable intermittency poses a risk to power reliability. In response, storage integration is becoming central to resilience planning. Battery systems are ranked in the top tier of five-year investment priorities, reflecting a shift from seeing storage as a supplementary asset to recognizing it as integral to network stability.

Utilities are also turning to flexible gas capacity to stabilize the system. When asked about expected baseload generation composition, respondents forecast natural gas to remain the largest share through 2030. However, only 22% are confident that new gas plants can meet near-term demand. This reflects a practical need for dispatchable power during a period of intense load growth and infrastructure strain. In a recent discussion, a leading U.S. investor-owned utility cited a major “shift of the center of gravity from what has been solar to natural gas-focused generation priorities.”

Regional dynamics: Different pressures, similar priorities

The pressures on grids vary by region, even as investment priorities converge.

The U.S. faces the steepest load increases, propelled by AI-driven data centers and industrial reshoring. Companies such as Duke Energy, Dominion Energy and Southern Co. have increased capital plans to expand and reinforce transmission and distribution networks, citing the need to connect large new loads while strengthening resilience against extreme weather.

European utilities face a different set of challenges. Demand growth is more moderate, but high renewable penetration and increasingly interconnected markets place a sustained strain on networks. Companies such as E.ON are directing the majority of capital toward network expansion and digitalisation to manage congestion, integrate renewables and maintain system stability.

Across regions, the objective is consistent. Whether driven by load growth or system complexity, utilities are investing to modernise networks, improve resilience and unlock additional capacity, reinforcing the grid’s role as a critical enabler of reliable power systems.

From bottleneck to enabler

Grid modernization is now the foundation of the energy transition. Investment logic has shifted from supply-side expansion to system-level resilience. Utilities are directing capital to the assets and technologies that guarantee reliability, create capacity for large-load customers and integrate renewables without compromising stability.

The pace of the transition will be determined by the strength and readiness of the networks that support it — and utilities are acting to ensure those networks are ready.

This article is part of our Powering Forward series:

How L.E.K. can help

Our teams advise energy leaders on where to invest, how to build resilient infrastructure and when to accelerate transition bets. Our 2025 Global Energy Study provides the data and insight; our consulting expertise helps clients translate these findings into decisions that create value today and secure a position for tomorrow.

For more details on the full study or to learn how these insights apply to your business, please contact our global energy team.

L.E.K. Consulting is a registered trademark of L.E.K. Consulting LLC. All other products and brands mentioned in this document are properties of their respective owners. © 2026 L.E.K. Consulting LLC

English
Executive Insights

Evaluating CPM Solutions in an Era of Platform Consolidation

February 27, 2026

Key takeaways

Corporate performance management (CPM) is shifting from cyclical budgeting to real-time decision infrastructure, driven by chief financial officer (CFO) demand for live visibility and cross-functional planning (extended planning and analysis) beyond finance.

Artificial intelligence (AI) adoption in CPM remains uneven. The gap between roadmap promises and production deployment matters more for investors than it does for buyers evaluating near-term workflow improvements.

Enterprise resource planning (ERP) vendors represent the primary competitive risk to CPM vendors, as many already offer baseline planning capabilities and continue investing to close gaps with more advanced stand-alone CPM solutions. 

Differentiation will hinge on how vendors defend their role against platform consolidation as planning systems evolve and ERPs expand capabilities, not just execution against legacy financial planning and analysis (FP&A) competitors. 

CPM software is drawing renewed attention amid a broader wave of investment across office of the CFO solutions. What used to be cyclical budgeting and planning is now broadly expected to function as a live decision system. CFOs want real-time visibility into performance, not just month-end outputs. Furthermore, vendors have pushed CPM solutions beyond finance-only use cases, making CPM relevant to operations, sales, human resources and marketing as seen with extended planning and analysis (xP&A).

As explored in a recent edition of L.E.K. Consulting’s Executive Insights on accounts receivable and accounts payable modernization, finance systems across the office of the CFO are being rebuilt around real-time data and AI. CPM solutions reflect a different expression of that shift; they are focused on enabling forward-looking, cross-functional decision-making rather than transactional efficiency.

The category is growing, but investor appetite hinges on hard questions: Can CPM solutions vendors maintain differentiation as ERP offerings improve? Is AI delivering measurable workflow value today? Which vendors can effectively serve different customer segments without adding unnecessary complexity? These questions matter more as transaction activity picks up and acquirers sharpen their evaluation frameworks. 

What is CPM and how does it differ from FP&A?

“CPM” still means different things to different people, complicating how buyers and investors evaluate vendors. CPM is best understood as the evolution of traditional FP&A.

FP&A historically meant periodic budgeting, forecasting and variance review. CPM takes that foundation and adds the capabilities leaders now expect: more frequent updates (including near real-time), scenario modeling and analytics that support planning and decision-making rather than retrospective reporting. Two shifts enable this:

  1. CPM pairs traditional FP&A workflows with business intelligence (BI)-style capabilities, enabling users to pull live snapshots rather than waiting for quarter-end reports.  
  2. It extends planning beyond finance through xP&A, turning what used to be a CFO dashboard into an operational tool for sales, supply chain, marketing and other functions.

For example, rather than finance producing a quarterly forecast in isolation, a CPM solution enables teams to pull live snapshots of performance and model the potential impact of pricing, hiring or operating changes, with finance, sales and operations working from the same planning model (see Figure 1). 

Figure 1

CPM aggregates data from ERP, CRM, HRIS and operational systems into a unified planning layer 

Image
Figure 1. CPM aggregates data from ERP, CRM, HRIS and operational systems into a unified planning layer

Figure 1

CPM aggregates data from ERP, CRM, HRIS and operational systems into a unified planning layer 

Image
Figure 1. CPM aggregates data from ERP, CRM, HRIS and operational systems into a unified planning layer

Why CPM is gaining traction now

Three demand drivers are converging, with disproportionate impact on CPM relative to other office of the CFO systems (e.g., transactional point solutions).

Finance teams are hitting scalability limits. Manual processes, data fragmentation and spreadsheet dependency create bottlenecks. Leaders want snapshots in time, not just quarterly narratives, which pushes planning from a recurring fire drill into an always-on capability best supported by CPM platforms.

The CFO role keeps expanding. CFOs are increasingly responsible for strategic planning, capital allocation and value creation alongside chief executive officers (CEOs) and boards. That shift raises the bar for finance systems, with CPM expected to support real-time decision-making rather than retrospective reporting, reflecting a growing overlap between CFO and chief operating officer (COO) responsibilities. This convergence is explored in our recent piece on CFO-COO alignment.

xP&A is pushing CPM beyond finance. Planning and analysis are no longer viewed as finance-only outputs. Sales, operations, supply chain, marketing and IT want shared planning models and a single source of truth for live performance data. This cross-functional demand is one of the clearest drivers of sustained CPM solution adoption.

These forces are pulling CPM into new territory, and vendor responses vary widely.

How vendors are positioning and where gaps remain

CPM vendors have entered the market from different starting points, including financial close, FP&A and more specialized reconciliation workflows. Over time, functionality has converged as vendors expand to address broader planning, reporting and decision-making needs. 

Figure 2.

Evolution of the CPM solution landscape

Image
Figure 2. Evolution of the CPM solution landscape

Figure 2.

Evolution of the CPM solution landscape

Image
Figure 2. Evolution of the CPM solution landscape

Three shifts define the current era:

  1. Cloud and integration maturity: There are more data sources, more connectors and more ability to pull from ERPs, customer relationship management (CRM) systems, human resources information and other operational systems into a unified planning layer.
  2. Analytics as core, not adjacent: BI-like capabilities have become part of the value proposition rather than a separate system that finance “also uses.”
  3. Broader stakeholder set: CPM increasingly serves finance plus the rest of the business through xP&A, which changes who influences buying decisions and what features matter.

Buying behavior increasingly favors platforms that unify data and workflows rather than point solutions that create reconciliation headaches. Integration and data security are table stakes. Differentiation comes from usability, real-time analytics, implementation ease and whether the platform can handle complex planning requirements without breaking.

All three shifts raise the same question: What actually differentiates vendors now? AI is often part of the answer, though its role varies in practice.

What role does AI play in CPM?

CPM is well-positioned for AI because it’s data-heavy, recurring and central to how leadership measures performance. The harder question is whether those features land in real workflows, across messy data environments, in ways CFOs trust enough to act on.

AI in CPM isn’t a single story. There’s already meaningful value in machine learning-driven capabilities: predictive forecasting, anomaly detection, pattern recognition and automated data cleansing. Generative AI use cases in CPM solutions are emerging, but adoption remains uneven. These use cases primarily appear in natural language querying, automated variance explanations and narrative reporting layered on top of existing models. The gap between roadmap promises and production deployment matters more for investors evaluating defensibility than it does for buyers focused on immediate workflow improvements.

Beyond AI adoption, the next biggest strategic question facing CPM vendors is platform consolidation.

Will ERPs absorb CPM functions?

This debate keeps surfacing, and it’s the one that most directly affects how durable CPM solution vendors will be.

There’s a credible case for CPM solutions as a durable best-of-breed layer:

  • Large and complex organizations may have multiple ERPs across entities, so CPM solutions serve as connective tissue that no single ERP can provide.
  • CPM solutions pull data beyond ERP (including from CRM systems, operational systems and departmental tools), expanding their role beyond financial data aggregation.
  • ERPs have historically been more rigid and slower to deliver the analytics and cross-functional planning capabilities buyers want.

There’s also a credible case for ERP disruption:

  • CPM solutions are increasingly viewed as a core operating layer for finance, making them deeply embedded in workflows.
  • That centrality makes CPM a natural consolidation target for broader platforms seeking to own planning and analytics end to end.
  • If ERP vendors close the gap on analytics, planning user experience and cross-system integration, significant portions of CPM functionality could compress into broader suites.
  • Large enterprise buyers often prefer fewer vendors, and ERPs have existing vendor relationships and implementation infrastructure.

CPM capabilities continue expanding even as ERPs improve, sharpening questions about where planning and decision support ultimately reside. Surviving vendors will need clear answers to the question of what they do that ERPs can’t or won’t do and whether that differentiation is defensible.

How should investors evaluate CPM vendors?

CPM remains an attractive category, with sustained demand driven by expanding planning use cases, cross-functional adoption and increasing strategic relevance within the office of the CFO’s tech stack. At the same time, that relevance has intensified competitive pressure as more platforms push into planning and analytics.

Vendors now face pressure from two directions: ERPs are expanding upward with better analytics, and emerging players are competing on faster implementations. Which solutions justify their position in an increasingly consolidated stack?

For investors evaluating CPM vendors, the key questions are:

  • Does the product offer genuine differentiation in analytics and planning capabilities, beyond surface-level feature parity?
  • Is AI delivering measurable user value beyond roadmap positioning?
  • Can the vendor remain durable if ERPs continue improving their planning workflows?
  • Will the vendor be able to expand into new customer segments without adding unnecessary complexity?

The category has momentum along with real strategic questions. For most buyers, CPM is unlikely to be swapped out wholesale for ERP-native functionality in the near term. Instead, differentiation will hinge on how vendors defend their role as planning systems evolve, ERPs expand capabilities and buyers reassess where advanced decision support truly belongs.

Our Financial Services team helps investors and software leaders navigate investments across the office of the CFO’s tech stack. We bring deep expertise across CPM, ERP and related financial software to uncover growth opportunities, support transactions and guide strategic decisions. Contact us to explore how we can support your next move in this space. 

L.E.K. Consulting is a registered trademark of L.E.K. Consulting LLC. All other products and brands mentioned in this document are properties of their respective owners. © 2026 L.E.K. Consulting LLC 

English

Not All Beauty Services Are Created Equal — Pricing Strategies Must Reflect That

February 27, 2026

Beauty and personal care services are often treated as a single category, but consumers do not think about them that way when it comes to budgeting. L.E.K. Consulting recently conducted a consumer study on pricing perceptions within multiple beauty service categories. We found that the same pattern repeats: Consumers sort services by how essential they feel, how often they use those services and how difficult it is to “do it yourself.” They then apply different rules about what feels like a fair price, what feels expensive and what is easy to postpone when budgets are tight. This is why pricing playbooks that work for one service can fail quickly in another, even when the underlying operations look similar.

To make this concrete, we will compare three common beauty services: haircuts, massages and microneedling. Haircuts are viewed as an everyday essential “critical moment” that creates price resilience even as a consumer’s budget fluctuates. Meanwhile, massages and then microneedling begin to be seen as an indulgence or a lower-frequency “treat” with price thresholds that drive strong and sensitive value expectations (see Figure 1).

Image
Figure 1. Tested services fall into each of these strategies, with the majority of services falling into lower-frequency categories
Image
Figure 1. Tested services fall into each of these strategies, with the majority of services falling into lower-frequency categories

Shaping the pricing resilience story: Essentiality and frequency

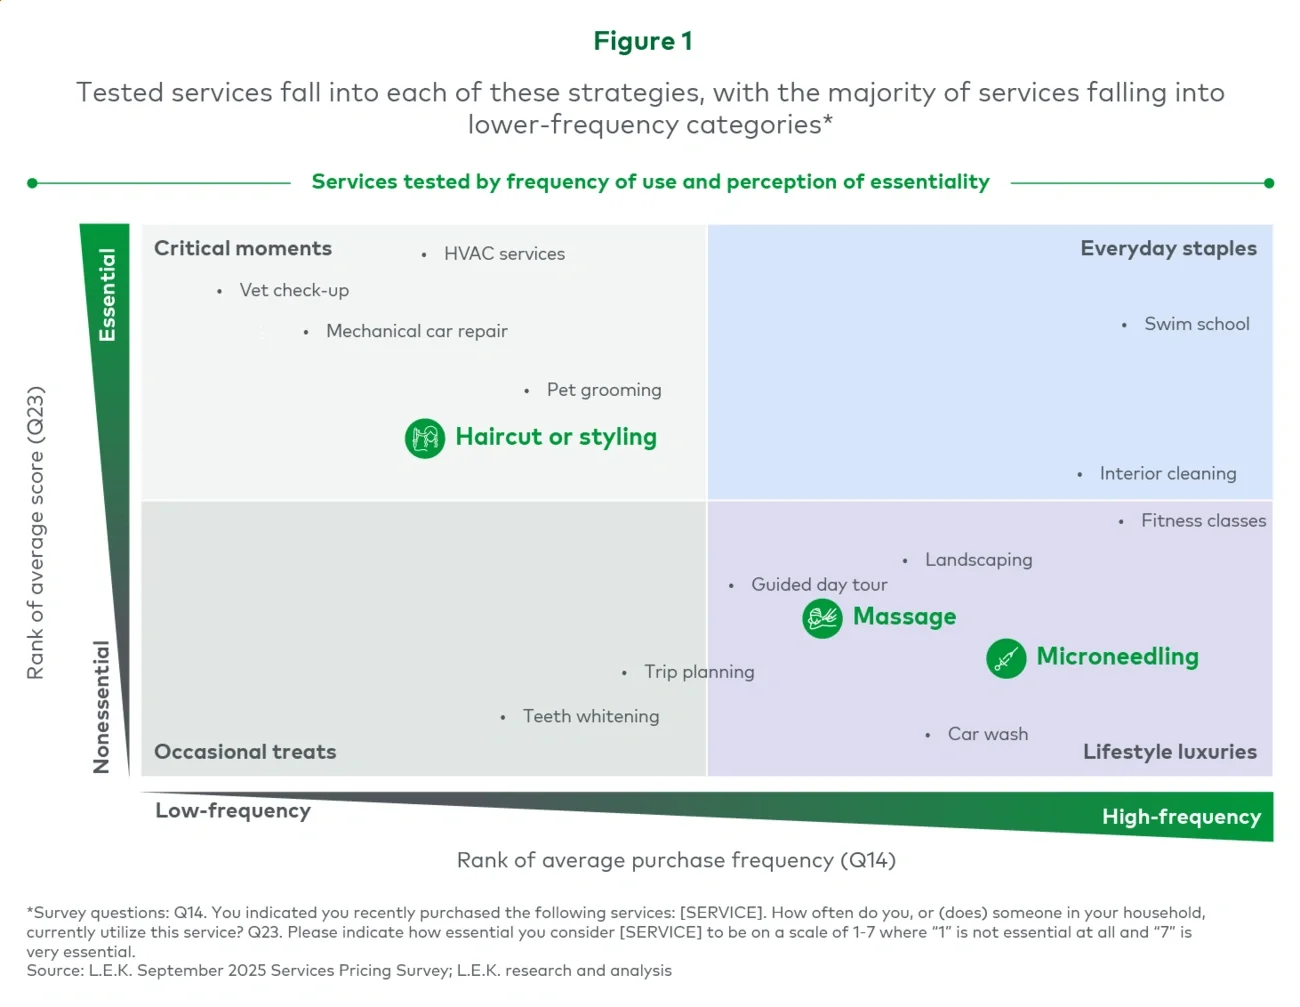
When a service is both frequent and perceived as essential (see top left “Critical moments” in the figure), it is more resilient to (although not completely unaffected by) price changes driven from macroeconomic impacts such as inflation. In these categories, the challenge is usually not whether people will still buy, but whether service providers can ensure predictable demand.

On the flip side, when a service is less frequent or more discretionary, price sensitivity typically rises because consumers have the option to delay the experience or to simply decide they can live without it for now. In these categories, it becomes less about small price moves and more about whether the perceived quality or consistency of the experience justifies the spend.

Finally, the highest-price, lowest-frequency services face the steepest drop-off when prices rise, but they deliver strong margins when value is well articulated.

This pattern is consistent with what we have seen in other fixed-capacity service domains. In a tougher macroeconomic environment, price change resilience increasingly depends not just on category, but also on how effectively businesses lock in repeat behavior and concentrate demand among their most loyal customers. For example, in the car wash sector, disciplined menu design, smart memberships and clear price governance help operators keep volume and cash flow steady, especially when inflation puts pressure on both consumers and operators.

Drivers of willingness to pay

Across beauty services, the study revealed a simple truth: Consumers pay for what feels good and what feels fair. Providers often overestimate the role of branding and underestimate the basics.

Haircuts tend to behave like a staple. They are high-frequency, socially visible and hard to postpone indefinitely without feeling the trade-off, which is why demand is typically more resilient to price changes. In practice, this means haircut pricing can often sustain demand even when prices increase. But consumers still expect the salons to be clear about what is being paid for, with whom they are booking and why one option costs more than another (e.g., stylist experience level). The opportunity is not to complicate pricing, but to reinforce predictable behavior through value structures that feel natural for a routine purchase.

Massages usually exhibit mixed results in terms of price change resiliency because they can be maintenance expenditures for some customers and indulgences and/or gifting occasions for others, even for those within the same income bracket. This also results in consumers’ dependency on consistent quality, since they will pay when the experience reliably delivers but will trade down or space out their visits when quality feels variable. In short, pricing power is earned through service quality and repeatability.

Microneedling is typically a premium, lower-frequency service, and that combination tends to create the sharpest thresholds. Consumers expect a clear value proposition — with service speed and ease of scheduling playing outsized roles — because they are making a deliberate, higher-stakes purchase rather than following a routine habit. More importantly, the higher-stakes purchase is also based on the trust a consumer has in a provider who has the experience, training and equipment to ensure the microneedling is done correctly.

For operators, this has two practical consequences. First, if service quality is really the product, then the consumers’ experience with an individual provider becomes the core economic unit because consumers will follow a person more readily than they will stay loyal to a brand. Second, if transparency is what builds trust, then unclear pricing, inconsistent inclusions and surprise fees tend to trigger immediate elasticity, even in categories where consumers are otherwise willing to spend.

A frequently missed dimension: Workforce segmentation

Beauty services are fixed-capacity businesses where the binding constraint is practitioner time, and not all time is equal. When consumer budgets tighten, the highest-performing and more experienced stylists and practitioners tend to drive outsized retention, higher tickets and greater resilience. This means pricing strategy should explicitly support their retention. Stylist capacity is not interchangeable.

For salons, this creates a clear imperative: Pricing, loyalty and scheduling strategies should explicitly support the retention of top talent, not just the acquisition of new customers. Effective talent strategies increasingly combine flexibility and earnings potential, with income covering a range that encompasses base compensation, variable upside, benefits and demand stability. Segmenting the workforce by value contribution (rather than tenure alone) allows operators to align pricing, loyalty benefits and growth investments with the stylists who most directly drive customer lifetime value and reinforce the consumer relationship with the talent and, by extension, with the salon.

Pricing strategy: One model does not fit all

Because the value perception and buying cadence are different, consumers do not expect the same pricing model across all beauty services. For haircuts, straightforward upfront pricing tends to remain the anchor, but there is a growing trend toward bundles or memberships that reward routine behavior with predictable scheduling or preferred-provider access rather than blunt discounts. For massage, multi-visit packages and loyalty tiers can work well when they reinforce consistency and reduce friction, especially if the benefits feel like access and convenience rather than price cutting. For microneedling, structured series packages can resonate with customers who want a treatment plan, while clear per-session pricing and transparent policies matter more to customers who are cautious about upfront commitments.

Across categories, loyalty programs and memberships represent a growing lever to stabilize demand, smooth revenue and increase customer lifetime value (particularly as consumers become more selective in where they spend). However, the point is not to push everyone into memberships, but to use the right mechanisms to make value apparent through features such as priority booking and preferred-provider access.

The hidden revenue engine: Add-ons and bundles

We found a striking insight in the study across all three services — consumers’ openness to add-on or ancillary services, which is a revenue lever underutilized by many providers. Add-on interest runs high across categories: approximately 47% for haircuts (conditioning, scalp treatments), about 53% for massage (aromatherapy, facials) and approximately 67% for microneedling (Botox, filler, facial upgrades). These add-ons can expand the ticket without forcing a base price increase that consumers may see as a fairness test, and they can also help operators create tiers that feel grounded in real value. Bundled services (e.g., hair + nails, massage + facial, microneedling + skincare) can help justify premium pricing while reinforcing perceived value.

In beauty, add-ons do more than drive revenue per visit. They create a way to further monetize services provided by top-tier talent while keeping an accessible entry point for newer practitioners. They also can make premium pricing feel justified because the consumer sees a fuller outcome rather than a higher line item.

What it all means for beauty operators and investors

Pricing in beauty works best when it starts with how consumers budget, and not with how operators wish they would buy. In an environment where consumers are more selective, resilience to price changes increasingly depends on building trust through transparency and ensuring willingness to pay by providing consistent quality, along with designing pricing strategies that drive demand among consumers with their go-to providers.

L.E.K. Consulting is a registered trademark of L.E.K. Consulting LLC. All other products and brands mentioned in this document are properties of their respective owners. © 2026 L.E.K. Consulting LLC

English
Subscribe to