

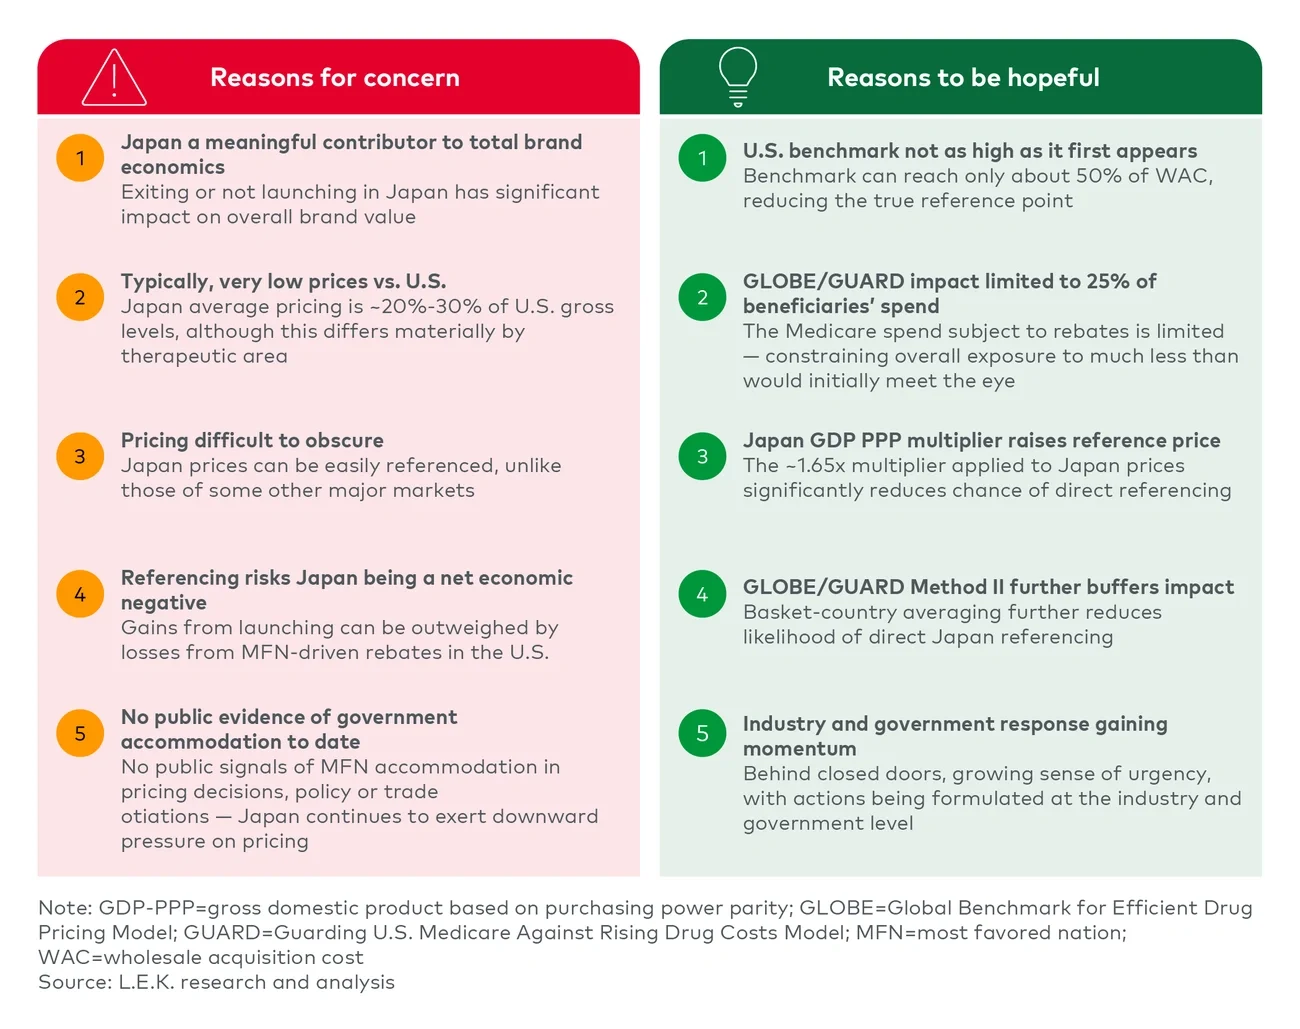
Japan’s exposure to U.S. MFN pricing is meaningful given its commercial importance and transparent pricing system, but the risk is more nuanced than headline price gaps imply, creating room for cautious optimism if companies quantify exposure and act early and purposefully (see Figure 1)
Executive Insights
An Inconvenient Truth? Japan, Innovation, Drug Pricing, MFN
An Inconvenient Truth? Japan, Innovation, Drug Pricing, MFN
How U.S. most-favored-nation (MFN) pricing reshapes the Japan business case
June 12, 2026
Key takeaways
Japan represents meaningful MFN exposure, given its strategic importance to global pharma revenues and its transparent, often lower NHI prices relative to the U.S.
The exposure is real but not uniformly severe; therapy area, payer channel and product archetype will determine whether Japan meaningfully influences U.S. MFN rebate calculations
There are reasons for cautious optimism, as GDP PPP adjustments, basket-country averaging and GLOBE/GUARD pilot caps may limit the likelihood that Japan alone becomes the binding benchmark
Risk is likely to concentrate in oncology, immunology and chronic/metabolic categories, while rare/orphan and cell and gene therapies appear relatively more insulated
Pharma companies should act now rather than wait for policy certainty by quantifying exposure, optimizing launch sequence, maximizing Japan pricing and reassessing partnering/commercialization strategies
Figure 1
Japan and US MFN — Meaningful exposure, but reasons for cautious optimism
Image
Japan has always been a paradoxical market in global pharma — and appears intuitively problematic in the context of MFN
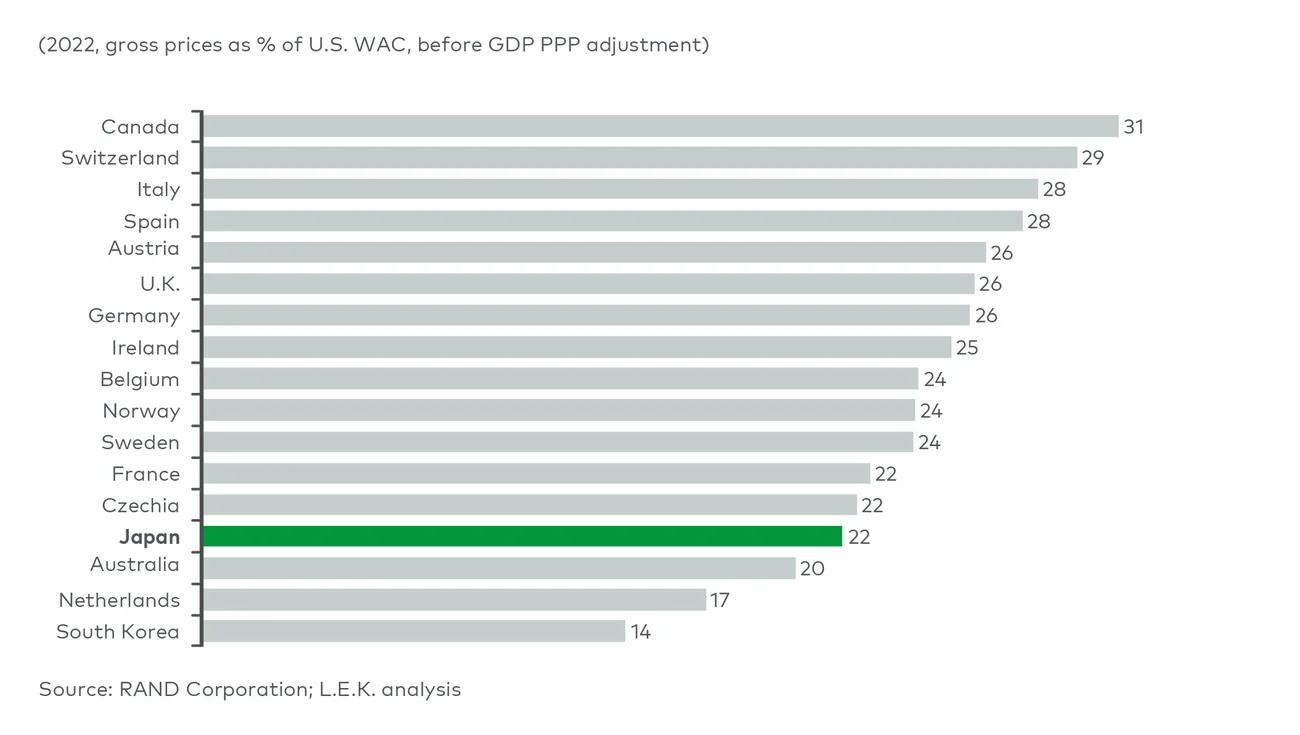
Japan is large, important to brands and too significant to dismiss. For many innovative products, Japan represents a meaningful share of global revenue (5%-20% for top-selling drugs), matters strategically and carries weight in global launch narratives (see Figure 2). Pricing, however, is not always especially strong (see Figure 3). Sometimes it is good. Often it is acceptable. Sometimes it is low. Importantly for this discussion, it is transparent.
Figure 2
Japan brand sales as a percentage of global total
Image
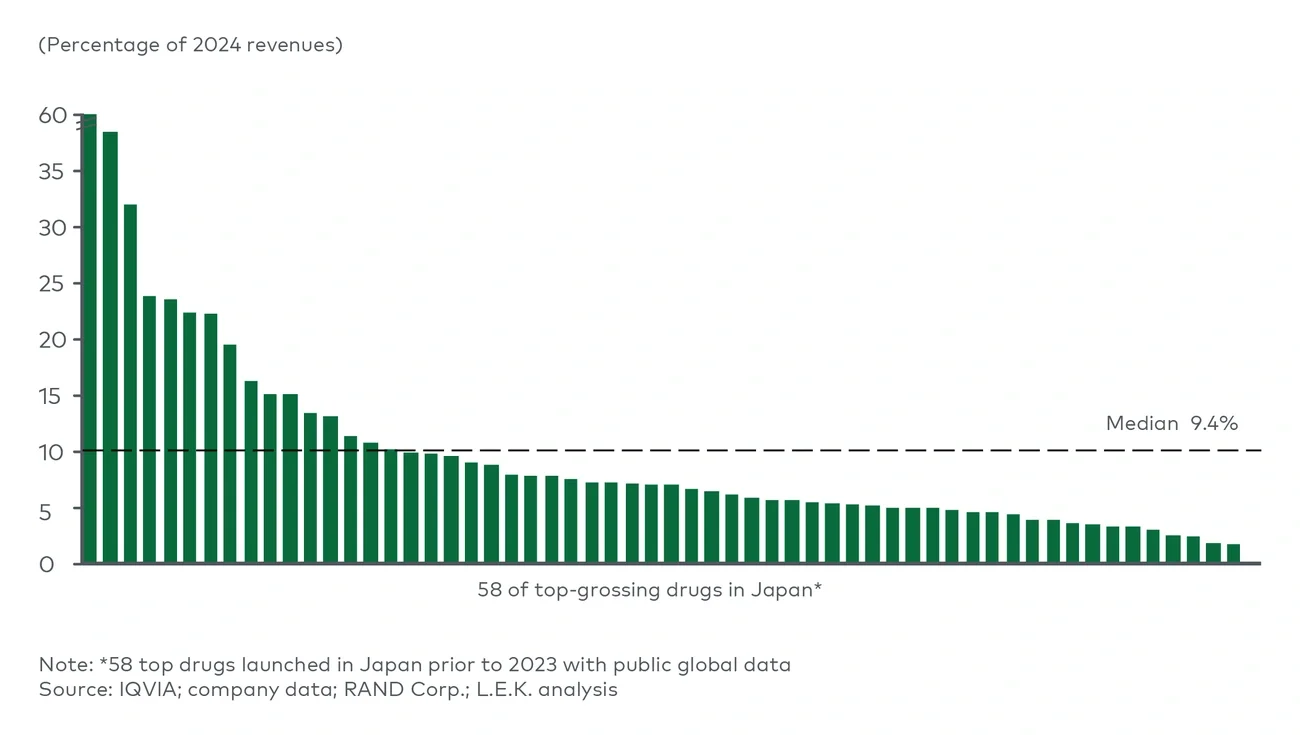
Figure 3
Japan pricing vs. other major markets
Image
That transparency matters in a world where the U.S. is exploring MFN pricing principles.
The U.S. remains the critical market for pharmaceutical return on investment. It disproportionately funds R&D, supports group profitability, and determines whether innovative assets create significant economic value or no more than accounting profits. But U.S. pricing is also a clear outlier and can be multiples of what is paid in other major pharmaceutical markets. Executive Order 14273 of April 2025 set the MFN agenda in motion and sought to redress what many see as an unsustainable and unfair global imbalance, through ensuring U.S. patient access to lower-priced medicines, pushing overseas markets to pay more, and shifting more of the burden of drug discovery and development outside the U.S.
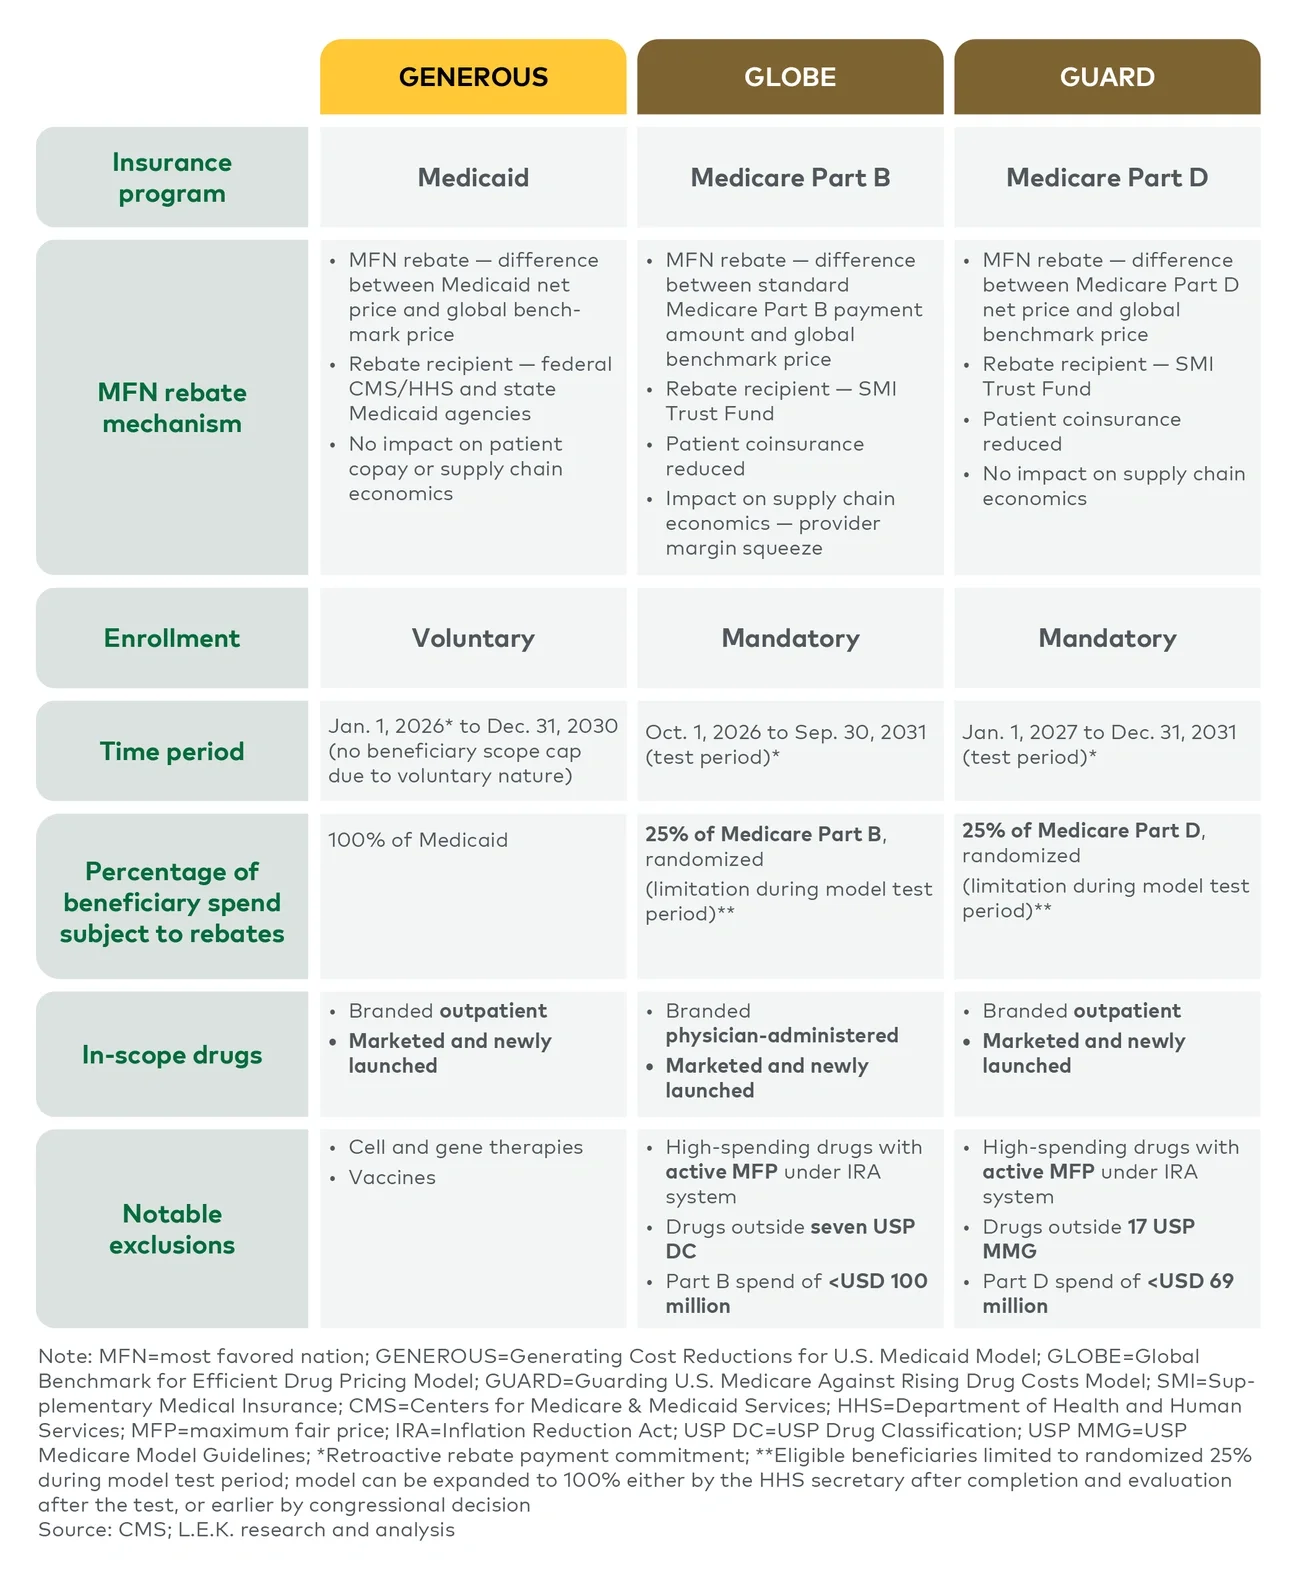
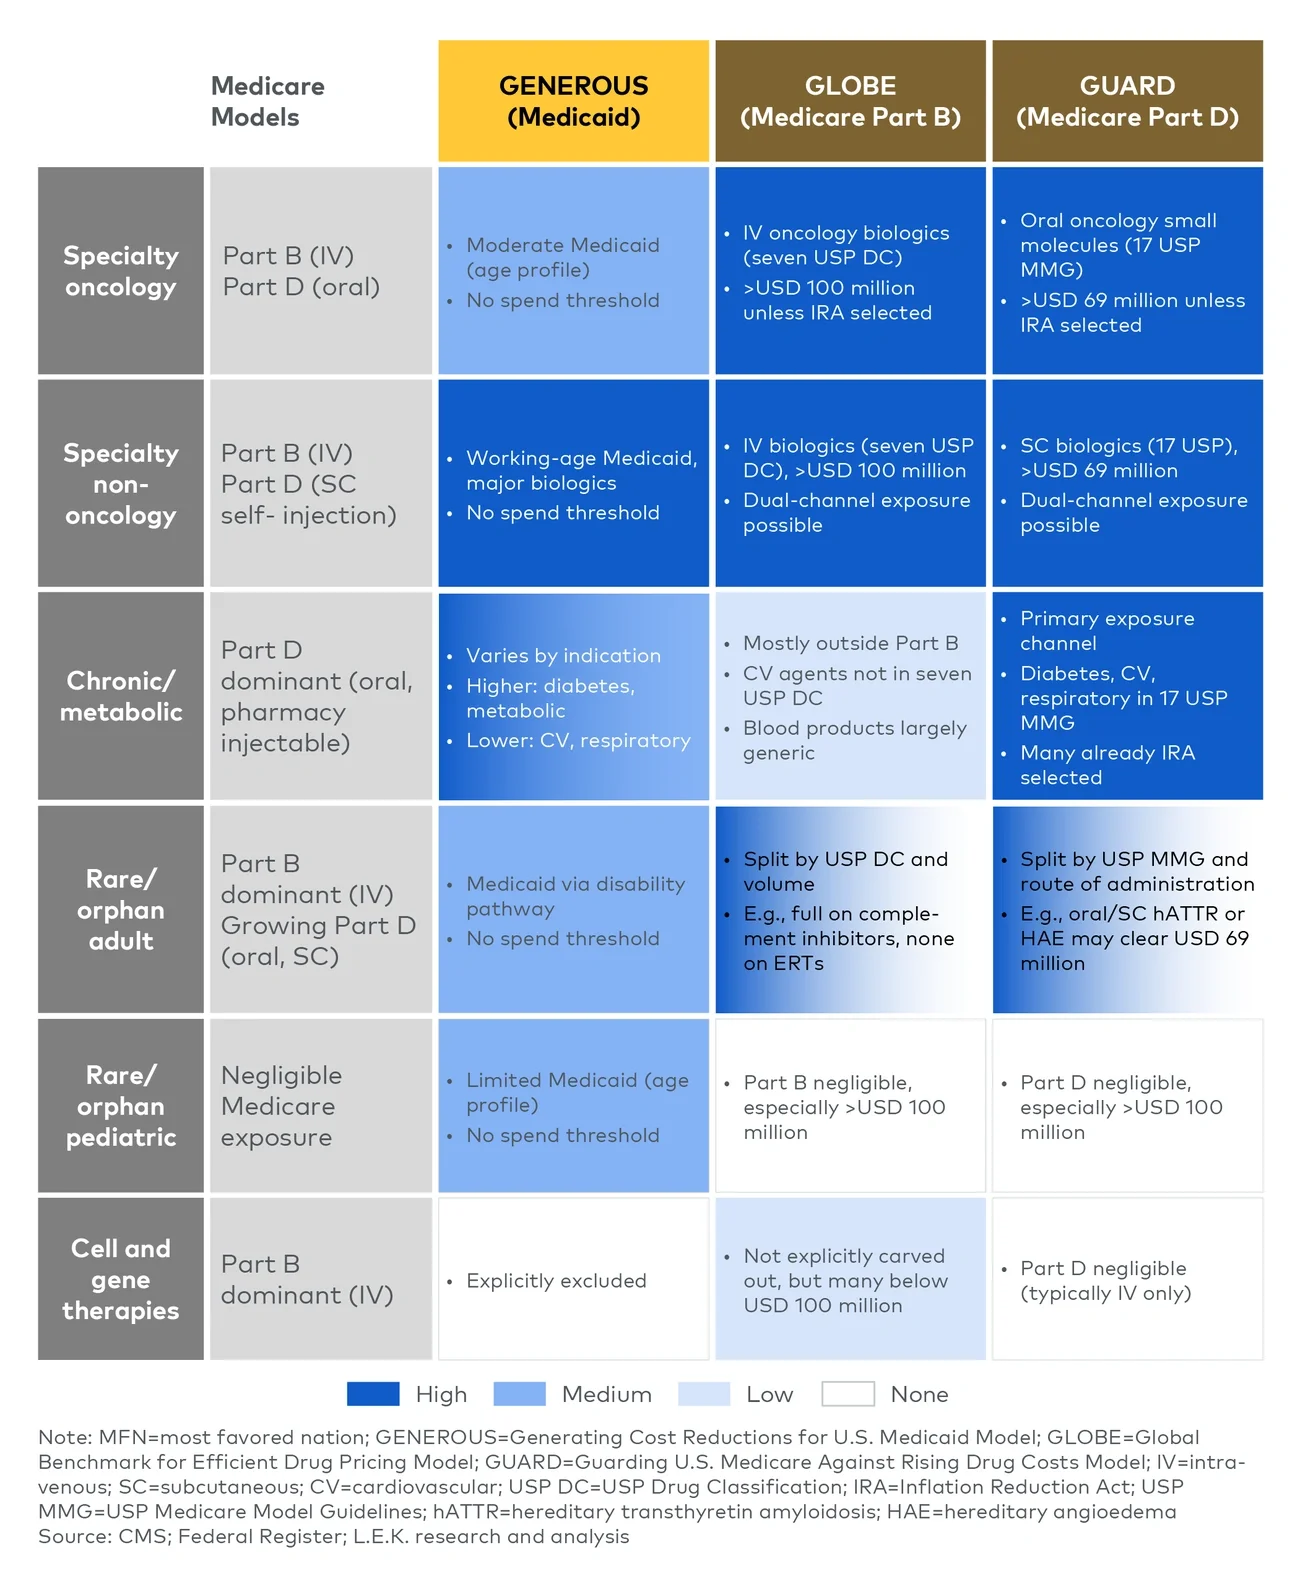
MFN policy implementation evolved from an initial voluntary pressure campaign that yielded 17 bilateral agreements to TrumpRx as the direct-to-consumer delivery mechanism and ultimately to three MFN pricing models (see Figure 4). Across models, the mechanism rebates U.S. prices down to international references — with the full economic impact borne by the U.S. business. In Medicaid, GENEROUS (Generating Cost Reductions for U.S. Medicaid Model) is voluntary and may give way to additional bilateral agreements. In Medicare, GLOBE (Global Benchmark for Efficient Drug Pricing Model) and GUARD (Guarding U.S. Medicare Against Rising Drug Costs Model) remain in test phase, capping rebates at the spend associated with 25% of enrollees. Full rollout seemingly would require legislation, the path for and ultimate design of which remain uncertain — though even a moderate package would reshape economics for in-scope products. Regardless, it would be imprudent for manufacturers to assume the issue will simply pass; the more durable posture is to plan for a structurally reshaped pricing landscape.
Figure 4
Overview of GENEROUS, GLOBE and GUARD models
Image
Japan’s pricing regime looks especially exposed; prices are unusually transparent and typically fall far below those in the U.S. The National Health Insurance (NHI) program’s prices are set through a defined rules-based methodology with formal caps on achievable premiums. Outcomes are made public, and confidential rebating between manufacturer and payer is absent. Postlaunch, the Ministry of Health, Labour and Welfare’s price survey takes about 3% off prices in an average year, though that headline figure masks considerable variation: Innovators with price maintenance premia hold up reasonably well, while post-loss of exclusivity products see materially steeper cuts. Further triggers, including market expansion repricing and cost-effectiveness analysis, push in the same direction. Recent reforms have offered some selective relief, notably the elimination of spillover repricing, but on the whole the trajectory still runs opposite to U.S. dynamics and the price gap continues to widen over the lifetime of a given drug.
What does the pharma sector’s actual Japan exposure look like?
Our analysis suggests that while manufacturer complacency is misplaced, the picture is more nuanced than headline exposure would imply. First, MFN exposure varies significantly by therapeutic area and the associated mix of U.S. payer channels. Exposure is concentrated in specialty oncology, immunology, and chronic and metabolic categories in the GUARD model, while pediatric rare and cell and gene therapies are more insulated (see Figure 5).
Figure 5
Directional MFN in-scope exposure by rebate model and drug archetype
Image
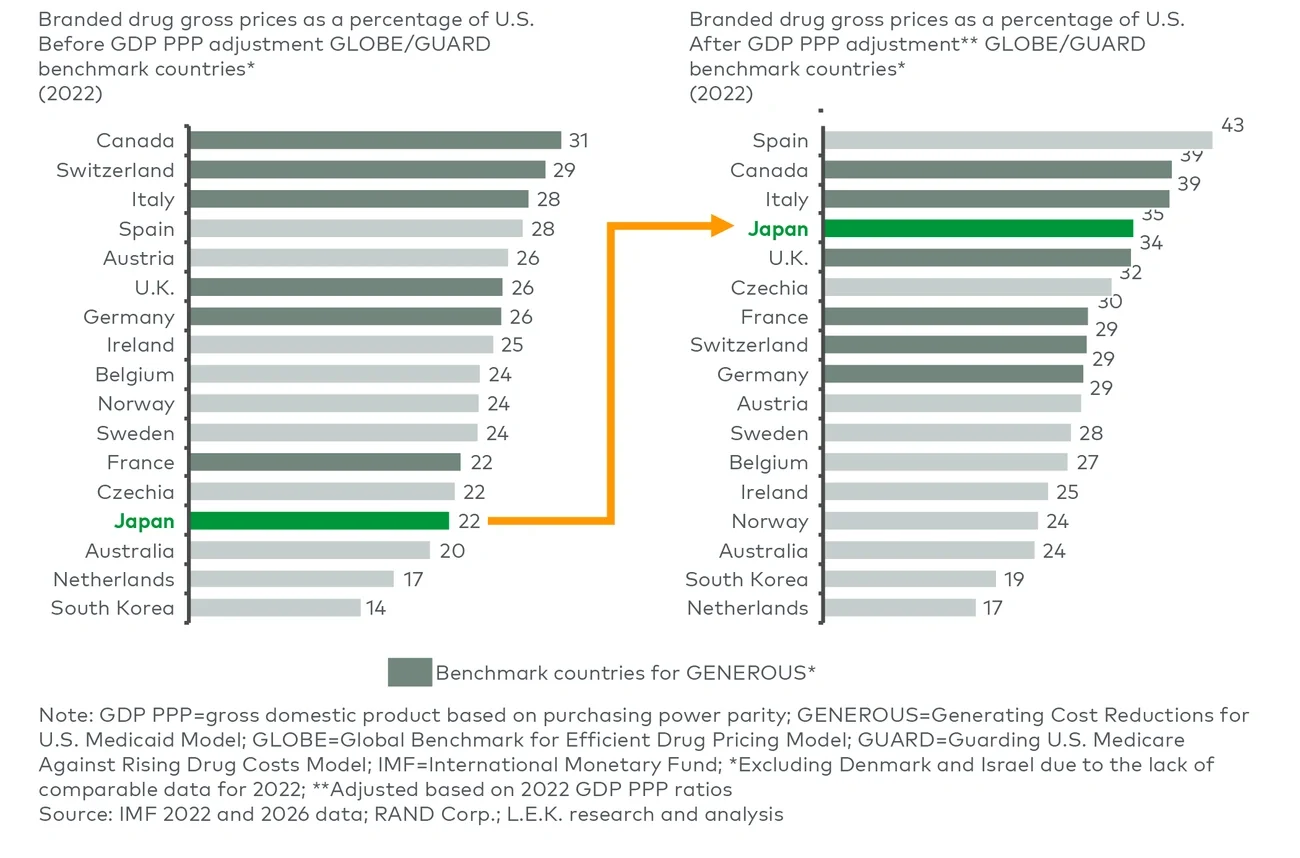
Second, Japan’s prices look problematic on an unadjusted basis, but the 1.65x GDP PPP (gross domestic product based on purchasing power parity) per capita adjustment reduces the likelihood that Japan becomes the sole benchmark (see Figure 6). Basket-country averaging under GLOBE/GUARD Method II further dampens Japan’s impact.
Figure 6
Impact of GDP PPP adjustment on Japan price differential
Image
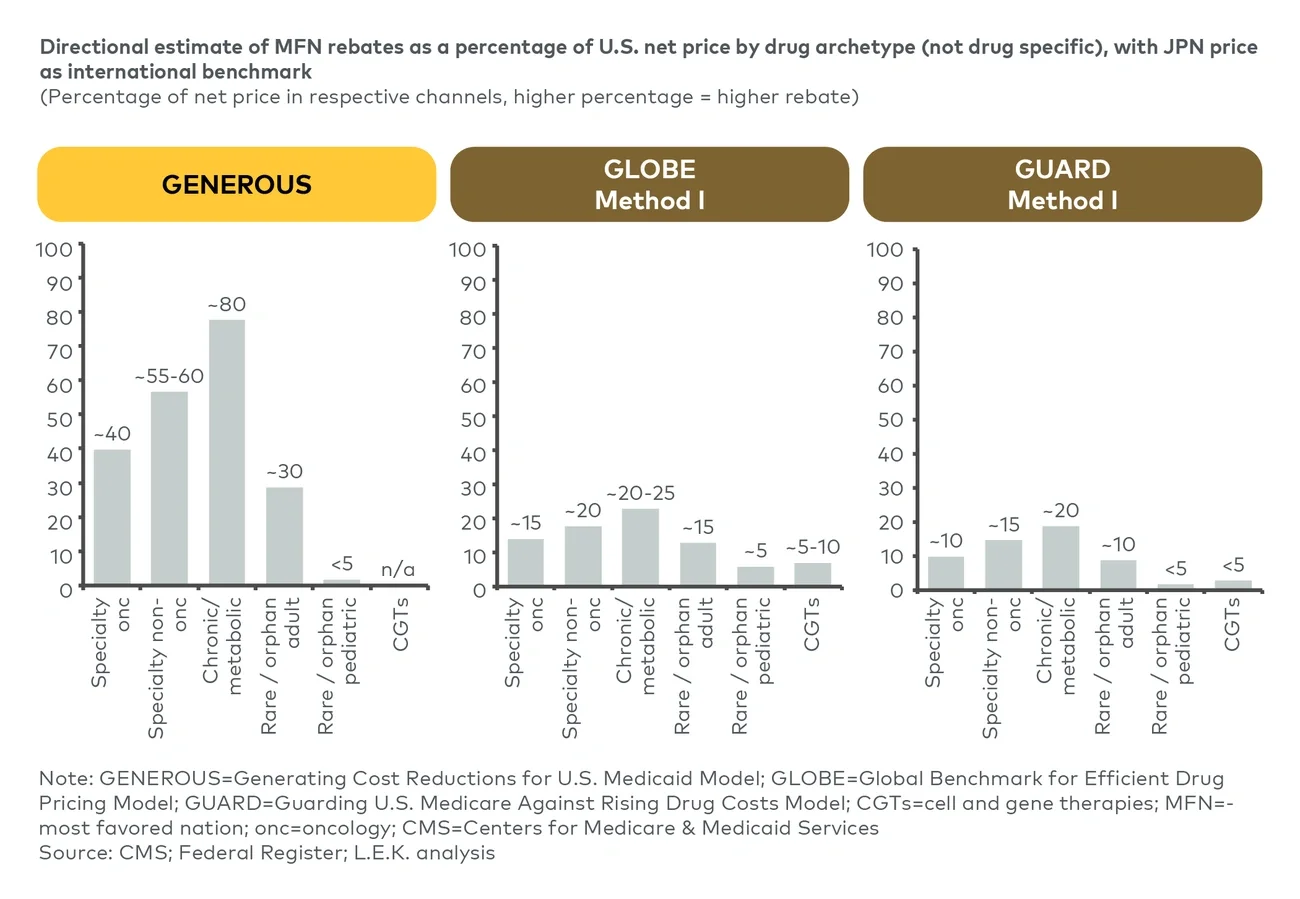
However, if Japan were to be set as the binding international benchmark, some drugs could face material U.S. MFN rebates (see Figure 7). GENEROUS would drive the deepest rebates, up to approximately 40%-80% of U.S. net price (given no 25% pilot cap), while GLOBE and GUARD are structurally softer at about 10%-25%. Rare/orphan and cell and gene therapies are relatively modest across all three.
Figure 7
Directional estimate of MFN rebates as a percentage of US net price by drug archetype (not drug specific), with Japan prices assumed as binding international benchmark
Image
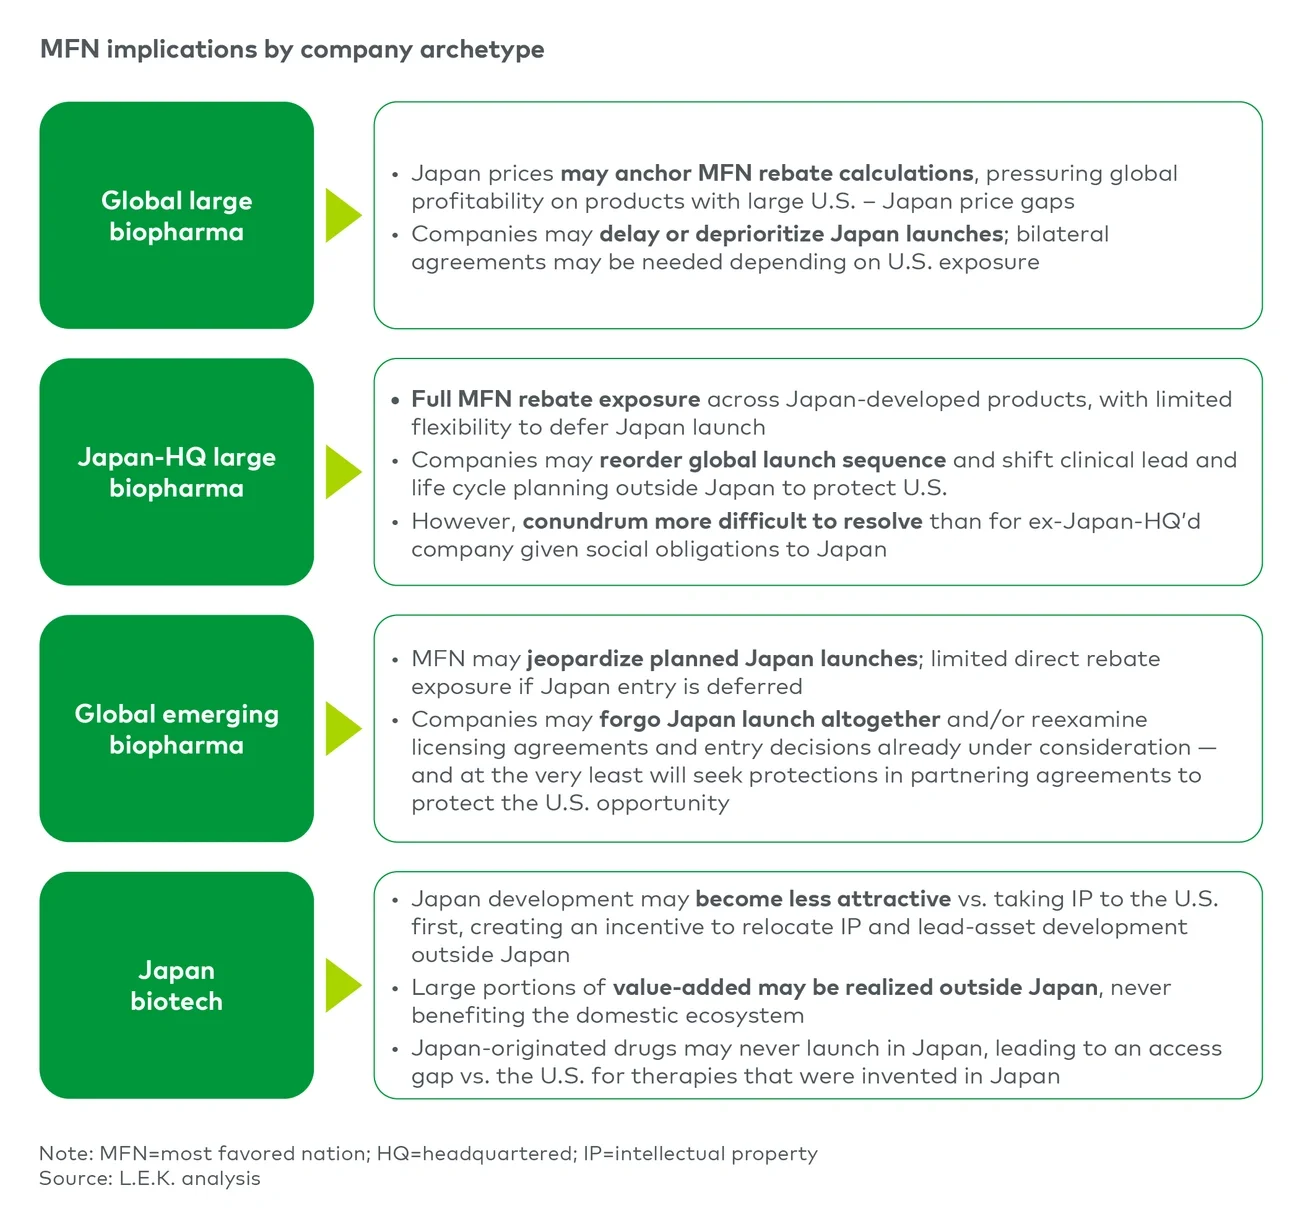
MFN exposure also is not uniform across company types (see Figure 8).
Global large biopharmas face direct rebate exposure where Japan prices anchor MFN calculations, particularly on products with wide U.S.-Japan price gaps; with their scale and access infrastructure, they can delay or deprioritize Japan launches and pursue bilateral agreements as needed.
Japan-headquartered large biopharmas face full MFN rebate exposure across Japan-developed products, with limited flexibility to defer Japan launches. They may reorder global launch sequence and shift clinical lead and life cycle planning outside Japan to protect U.S. economics, although the conundrum is harder to resolve than for peers headquartered elsewhere, given social obligations to Japan.
Global emerging biopharmas have less direct exposure where Japan entry is deferred, but MFN may jeopardize planned Japan launches; some will forgo Japan altogether or reopen licensing decisions, and at minimum will seek protections in partnering agreements to safeguard the U.S. opportunity.
Japan biotech also faces challenging constraints: Japan development looks less attractive than taking intellectual property (IP) to the U.S. first, creating incentives to relocate IP and lead-asset development outside Japan — with the risk that much of the value-added is realized offshore and Japan-originated drugs never launch domestically.
Figure 8
Japan MFN implications vary materially by company archetype — Japan-HQ players face the most constrained set of responses
Image
So, what should companies do?
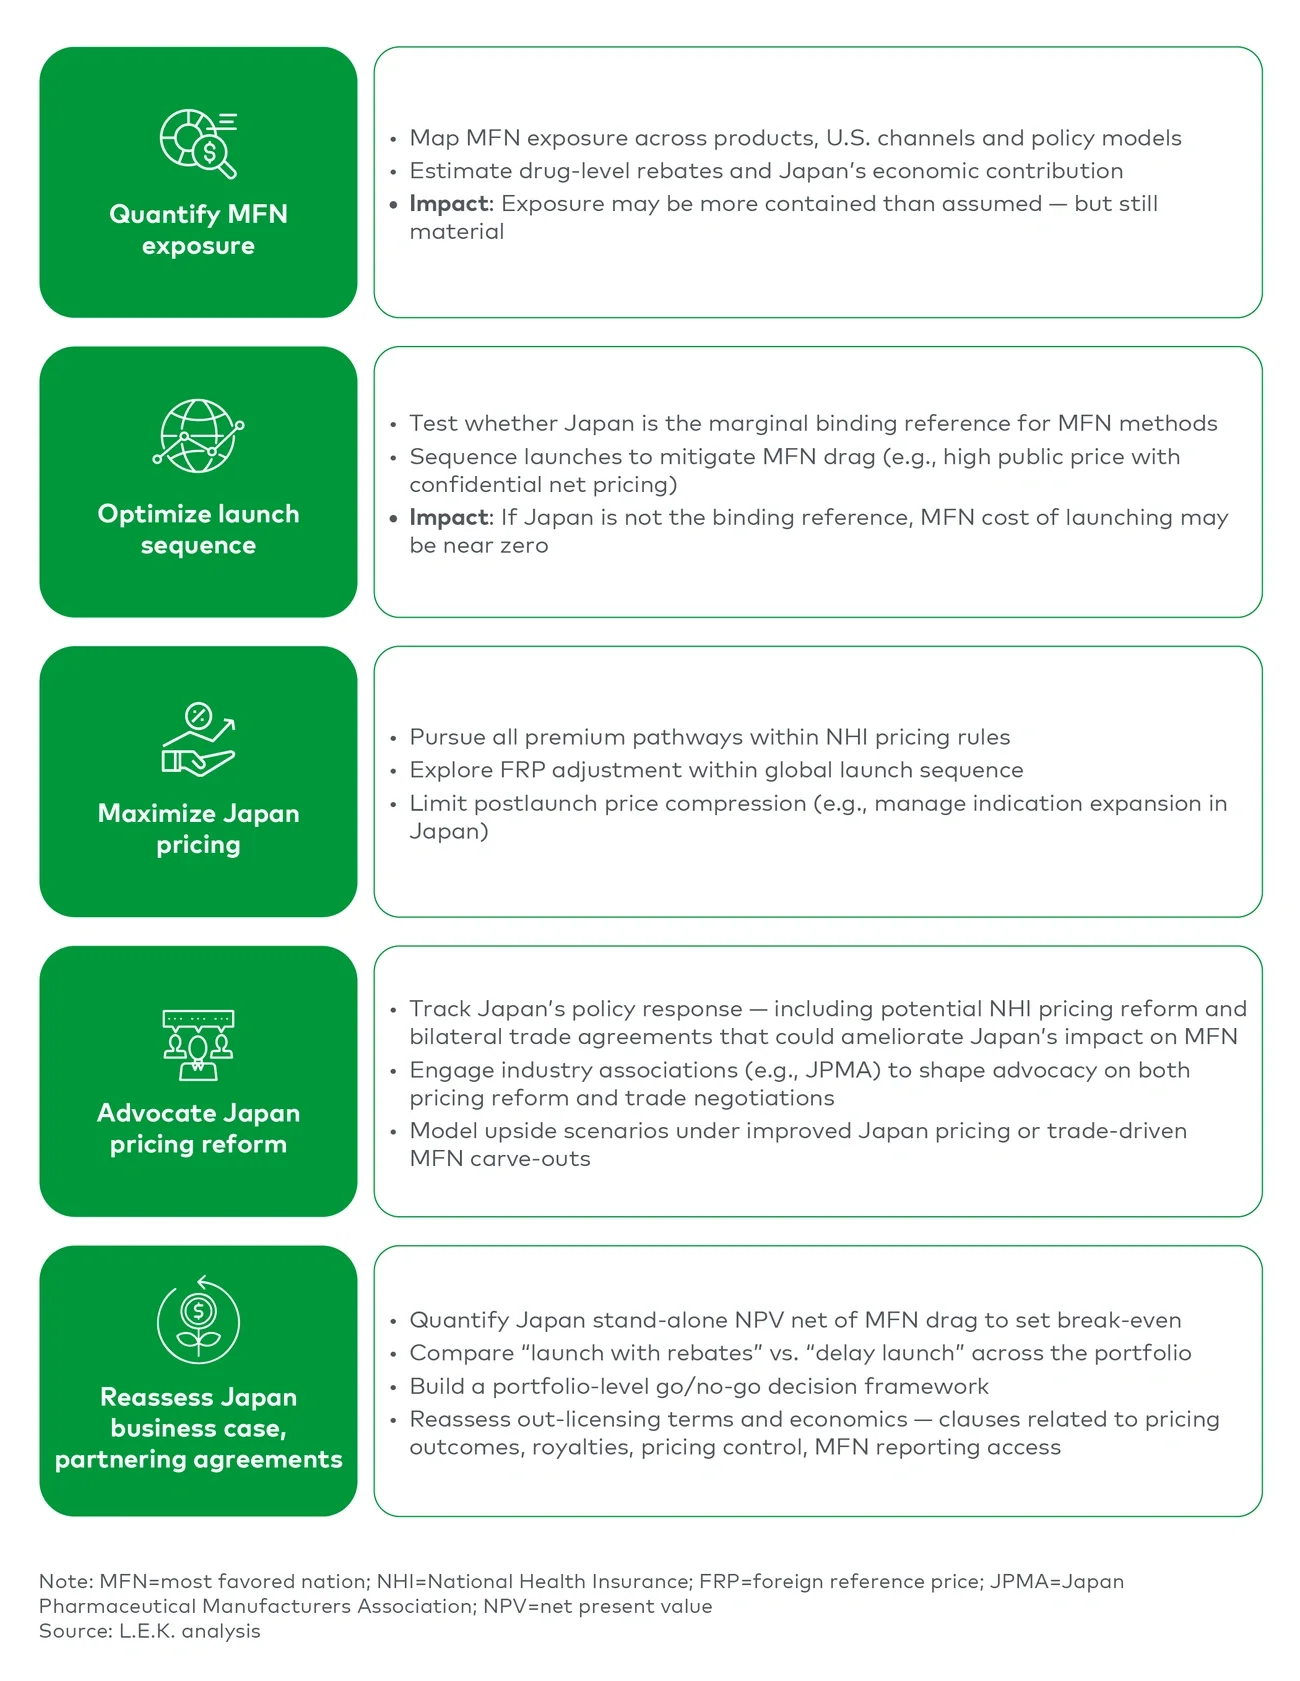
Companies need a practical response, with five elements running in parallel (see Figure 9):
- Quantify MFN exposure: Map it across products, U.S. channels and policy models; estimate drug-level rebates and Japan’s economic contribution
- Optimize launch sequence: Test whether Japan is the marginal binding reference, and sequence launches (e.g., high public price with confidential net pricing) to mitigate MFN drag
- Maximize Japan pricing: Pursue all premium pathways within NHI rules, explore foreign reference pricing adjustment within global launch sequence and limit postlaunch price compression (e.g., manage indication expansion)
- Advocate Japan pricing reform: Track NHI reform and bilateral trade developments, engage industry associations (e.g., Japan Pharmaceutical Manufacturers Association) and model upside under improved Japan pricing or trade-driven MFN carve-outs
- Reassess Japan business case and partnering agreements: Quantify Japan stand-alone net present value after accounting for MFN drag, compare “launch with rebates” versus “delay” at portfolio level, and revisit out-licensing terms (pricing outcomes, royalties, pricing control, MFN reporting access)
Figure 9
Japan MFN requires a five-part playbook — quantify, optimize, maximize, advocate and reassess
Image
This is where L.E.K. can help
L.E.K. Consulting can help companies size their exposure, identify the products and therapeutic areas that matter most, model the U.S. and Japan profit and loss implications, and define practical response options. That includes portfolio screening, therapeutic area prioritization, company and product exposure assessment, launch and life cycle strategy, and support on pricing, market access and policy response.
Japan matters commercially, strategically and politically. The challenge now is to preserve that value while managing the risk that Japan’s price transparency erodes economics elsewhere — a balancing act that will reward those who quantify exposure, sequence launches and plan early.
L.E.K. Consulting is a registered trademark of L.E.K. Consulting LLC. All other products and brands mentioned in this document are properties of their respective owners. © 2026 L.E.K. Consulting LLC
Related insights
You might also be interested in these insights.


English