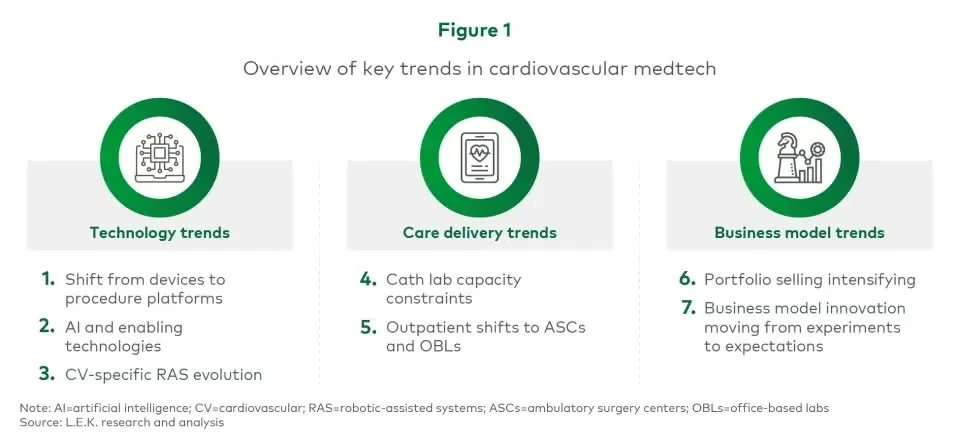
How Investors Evaluate Legal MSO Opportunities

February 27, 2026

In most states, managed services organizations (MSOs) let investors deploy capital into law firms without violating ethics rules that prohibit nonlawyer ownership. Recent regulatory opinions have clarified how these structures can work within existing rules.

For more on how MSOs are structured, see Part I of our series. Part II focuses on the investment case: deal economics, practice area fit and what separates successful platforms from failed ones.

MSO payment models

MSO investors deploy capital through infrastructure acquisition (office leases, technology systems, equipment, operational contracts) and growth investments (marketing spend, intake operations, business development). The MSO is compensated through a management fee defined in the management services agreement.

Two payment structures dominate:

Flat-fee model: A midsize firm generating $20 million in annual revenue might pay an MSO $18 million annually to handle all nonlegal operations. If the MSO’s actual costs are $15 million, it earns $3 million in profit while the firm retains $2 million. The fee remains fixed regardless of firm performance.

Cost-plus model: A smaller personal injury practice with $5 million in revenue might use cost-plus pricing, reimbursing the MSO for operating costs plus a 15% margin. If the MSO invests $8 million to scale marketing, driving firm revenue to $12 million, the MSO earns $1.2 million in profit. The structure remains compliant because the margin is fixed, not tied to legal revenue percentages.

The critical variable is durability. Investors underwrite the management services agreement as the foundation, typically a long-term contract with renewal and termination protections. Since the MSO fee is paid before partner distributions, successful deals build alignment through fair market value fees, scope adjustment terms and rollover equity.

Value creation at the MSO level

Returns come from two mechanisms:

Margin expansion: Operational efficiencies from standardized processes, vendor negotiations and technology deployment allow the MSO to reduce costs while maintaining service levels.

Platform scalability: Shared services across multiple firms or practice groups create economies of scale. Centralized intake, unified technology systems and consolidated vendor relationships spread fixed costs across a larger base.

Practice area characteristics determine where these mechanisms create the most value.

MSO suitability by practice area and investment criteria

Not all legal practices benefit equally from MSO dynamics. Practice areas can be evaluated for fit across several criteria, including:

  • Marketing dependence: The degree to which scalable marketing investments generate client flow as opposed to relationship-driven or referral-based acquisition
  • Customer fragmentation: Whether the practice serves a high volume of individual clients or concentrates on fewer, larger relationships
  • Operational scalability: The degree to which workflows are repeatable and can be standardized across cases
  • Geographic scope: Whether the practice can operate across multiple jurisdictions or is tied to local courts and relationships

Evaluating a nonexhaustive sample of practice areas illustrates how these criteria shape MSO fit (see Figure 1).

Image
Table showing how suitable MSOs are for Personal Injury, Consumer Bankruptcy, Family Law, Corporate M&A, and Criminal law based on marketing needs, client mix, scalability, and geographic reach
Image
Table showing how suitable MSOs are for Personal Injury, Consumer Bankruptcy, Family Law, Corporate M&A, and Criminal law based on marketing needs, client mix, scalability, and geographic reach

High-fit practices

High-fit practices share common characteristics. Practice areas such as personal injury, mass tort, consumer bankruptcy and debt relief combine marketing-driven demand, fragmented customers, repeatable workflows and sufficient portability to support centralized services. Other practice areas with similar characteristics may also demonstrate strong MSO fit.

The “programmatic plaintiff” model illustrates this dynamic. The MSO centralizes intake, marketing, case screening and shared services, while the law firm focuses on execution. Significant costs such as advertising and working capital sit with the MSO without triggering fee-sharing concerns.

Low-fit practices

Low-fit practices typically involve bespoke work, partner-dependent outcomes and relationship-led growth. Practice areas such as corporate M&A, complex commercial litigation and Big Law-style advisory work demonstrate these characteristics.

Criminal defense faces additional structural constraints, including heightened court scrutiny, tighter regulation of marketing and economics, and strong local dependencies.

Family law and trusts and estates sit between these extremes. Marketing plays a role and workflows are partially standardizable, but local court dynamics limit scalability.

MSO case studies and diligence risks

The MSO model is still emerging. Recent transactions show how the structure is being deployed:
Rimon PC entered one of the first notable MSO deals with Alpine Investors, which invested in an MSO (NovaLaw) that took over firm operations in 2021. The structure provided capital to modernize technology while preserving lawyer-partner equity. Rimon’s CEO later characterized the deal as a success, citing it as evidence that MSOs can fund legal tech growth while aligning investor and lawyer incentives.

Certum Group, a Texas-based litigation finance specialist, launched Certum Legal Solutions in October 2025 following the acquisition of an MSO, partnering with several mass tort firms on a fee-for-service basis. The move reflects growing investor interest in MSO platforms within high-volume consumer practices.

Cohen & Gresser explored private equity financing in late 2025 via a $40 million convertible note that could convert into MSO equity, illustrating how firms can bridge capital needs ahead of a fully established managed services entity.

Failed MSO structures: Lessons from the legal and healthcare sectors
 

Regulatory failures provide cautionary tales.

UpRight Law operated a nationwide bankruptcy business where nonlawyer staff handled significant client interactions with inadequate attorney supervision. The Department of Justice found this led to misleading practices. UpRight paid over $300,000 in consumer relief and was barred from representing bankruptcy clients in Montana for six years.

Avvo Legal Services operated a platform in which clients paid Avvo for legal services, Avvo paid participating lawyers and the lawyers paid Avvo a marketing fee. State bar authorities raised concerns that the structure involved impermissible fee-splitting or referral arrangements, and Avvo ultimately discontinued the service in 2018.

Cautionary tales also exist in healthcare. Envision Healthcare, Northfield Medical Center and Orthodontic Centers of America all faced challenges when their MSO structures exerted de facto control over professional decisions or extracted economics that functioned like profit-sharing.

At the same time, healthcare MSOs such as Heartland Dental (backed by KKR, supporting 1,800-plus locations nationwide) demonstrate the model works at scale when professional independence and arm’s-length economics are rigorously maintained.

Success factors and warning signs

MSOs succeed when they offer operational expertise beyond capital and work within high-volume practices needing infrastructure discipline. They fail when investors prioritize quick exits over firm culture or when agreements drift toward impermissible control. Red flags for due diligence include:

  • Pressure for profit-linked compensation
  • Influence over lawyer hiring
  • Terms edging toward nonlawyer ownership or control
  • Weak compliance controls
  • High attorney departure risk
  • Structures where lawyers have minimal equity
  • Key person concentration without retention protections

What this means for MSO investors

Investors evaluating these opportunities should consider several factors:

Practice fit. The strongest returns come from high-volume consumer practices with marketing-driven growth, repeatable workflows and business-to-consumer economics. Practice areas including personal injury, mass tort, consumer bankruptcy and debt relief fit this profile, allowing centralized intake, data-driven case screening and standardized operations that create measurable value at the MSO level. Bespoke advisory work presents structural challenges.

Deal structure. Investors buy equity in the MSO, often alongside partner rollover equity. Capital gets deployed to acquire nonlegal infrastructure and fund growth through marketing and intake operations. Returns come from recurring management fees, margin expansion and platform scalability. Because the MSO fee is paid before partner distributions, alignment mechanisms are critical to prevent attorney departures. Regulatory compliance must be rigorous and jurisdiction-specific.

Diligence. Regulatory scrutiny focuses on operational reality, not legal structure. Investors should underwrite the MSO’s contracts, nonlegal assets and management fee cash flows. Understanding where value gets created, how talent is retained and whether the separation between law and business is genuine separates viable platforms from regulatory exposure.

As we’ve covered in this two-part series, legal MSOs offer investors a regulatory-compliant path into an attractive and growing market. L.E.K. Consulting helps investors evaluate opportunities in legal and compliance markets, assessing deal fit, structuring diligence frameworks and supporting M&A decisions.
 
Reach out to discuss how we can help.

L.E.K. Consulting is a registered trademark of L.E.K. Consulting LLC. All other products and brands mentioned in this document are properties of their respective owners. © 2026 L.E.K. Consulting LLC 

English
Executive Insights

The Most Investable Segments in Youth Sports Going Into 2026

February 27, 2026

Key takeaways

Youth sports is now a scaled and resilient market, with families maintaining participation through economic downturns and spending rising to roughly $1,000 per athlete.

Physical infrastructure is professionalizing in parallel, with facilities, tournaments and club networks using standardized systems to improve utilization and expand recurring revenue.

Capital is concentrating in youth sports technology, where integrated platforms that unify registration, payments, scheduling and video are emerging as natural entry points into club and league operations.

Building real scale remains difficult because labor-intensive go-to-market dynamics, sport-specific credibility, capital-intensive assets and operational growing pains are limit how quickly platforms can expand.

The U.S. youth sports market generates around $40 billion annually. Every year about 30 million athletes participate in tens of millions of organized events, from local leagues to national tournaments. The sector is attractive to investors given its noncyclical demand, recurring revenue and fragmented ownership. Families continue prioritizing participation even during downturns, with about 70% maintaining involvement and roughly 60% viewing sports as essential to development and college readiness.

Household spending on youth sports has risen sharply over the past decade. Per-athlete annual spend increased from roughly $700 in 2019 to about $1,000 in 2024 across registration fees, travel and equipment. And about one-third of families now report taking on debt so their kids can participate in sports.

Image 1.

Open configuration options Average annual spend on child’s primary sport (2019-24)

Image
Image 1. Average annual spend on child’s primary sport (2019-24)

Image 1.

Open configuration options Average annual spend on child’s primary sport (2019-24)

Image
Image 1. Average annual spend on child’s primary sport (2019-24)

Participation has fully recovered from pandemic lows. Among ages 6 to 17, team sport participation rose 9% year over year in 2024. Lower-income households have posted notable gains as community programs and post-COVID-19 funding expanded.

This growth is reshaping the industry. What was once volunteer-run recreation has evolved into a year-round professionalized marketplace. Clubs that previously ran seasonal programs now operate like small enterprises, often charging $1,000-$2,000 annually per player before travel costs. Up to 35% of high school athletes now specialize in a single sport, training more than eight months per year. That intensity requires facilities, coaching and competition outside school seasons, making club sports essential infrastructure rather than optional enrichment.

The three-pillar investment framework

This shift toward professionalized operations has created three investable categories: technology, infrastructure and services, and programming (see Figure 1).

Figure 1.

Overview of investable areas in youth sports

Image
Figure 1. Overview of investable areas in youth sports

Figure 1.

Overview of investable areas in youth sports

Image
Figure 1. Overview of investable areas in youth sports

The most defensible businesses combine at least two pillars. Software paired with facilities captures both digital and physical economics. Clubs and leagues that combine programming with merchandising extend monetization beyond the season. Integrated platforms separate scalable businesses from local operators.

Over the past two years, capital has concentrated most heavily in technology.

Digital infrastructure as a natural entry point

Youth sports management platforms support the operational backbone of clubs and leagues: registration, scheduling, payments, team communication and, in many cases, livestreaming or analytics. Their economics blend predictable subscription revenue with payment-volume fees and sponsorship data opportunities.

The market remains fragmented, ranging from established players like Stack Sports and SportsEngine with broad functionality to newer entrants competing on modern design and workflow simplicity. The landscape spans a wide range of platform scope, from focused, sport-specific tools to broader multisport platforms designed to support club and league operations (see Figure 2).

Figure 2.

Youth club management landscape by scope and focus

Image
Figure 2. Youth club management landscape by scope and focus

Figure 2.

Youth club management landscape by scope and focus

Image
Figure 2. Youth club management landscape by scope and focus

This fragmentation has begun to drive consolidation. Accel-KKR has backed LeagueApps and ArbiterSports to build end-to-end capabilities across registration, scheduling and officiating. Genstar Capital continues expanding Stack Sports through bolt-on acquisitions that integrate analytics and communication tools.

Beyond core management software, investors are increasingly exploring adjacent layers, including livestreaming (Scorability), safety and compliance (Players Health) and media and events (Prep Network), building vertically integrated ecosystems rather than single-product platforms (see Figure 3).

Figure 3, part 1.

Recent private-equity deals in youth sports (2024-26) 

Image
Recent private-equity deals in youth sports (2024-26)

Figure 3, part 1.

Recent private-equity deals in youth sports (2024-26) 

Image
Recent private-equity deals in youth sports (2024-26)

Figure 3, part 2.

Image
Figure 3, part 2. Recent private-equity deals in youth sports (2024-26)

Figure 3, part 2.

Image
Figure 3, part 2. Recent private-equity deals in youth sports (2024-26)

The direction is clear: Platforms are moving toward true integration, linking payments, video, compliance and facilities through open application programming interfaces. Clubs increasingly expect one-stop solutions. The challenge is execution. Legacy platforms often rely on patchwork acquisitions that create inconsistent interfaces and redundant capability sets. Investors are betting on the next generation of clean, unified systems built around actionable data.

Physical assets follow digital

Capital is also flowing into facilities, tournaments and apparel, tying together the fields where kids play, the systems that run them and the commerce surrounding them. More than $2.5 billion has been invested in new or upgraded youth sports complexes between 2024 and 2026, with operators like The Sports Facilities Companies and Kemper Sports incorporating digital scheduling and registration into their models to maximize utilization.

Consolidators are using the same approach. 3STEP Sports, backed by Juggernaut Capital Partners, operates more than 300 clubs and has acquired operators like Front Range Volleyball Club, standardizing operations across its network. Unrivaled Sports, backed by Dick’s Sporting Goods, manages a portfolio of tournament properties and facilities including Ripken Baseball and Cooperstown All Star Village, using integrated systems to streamline payments and team management.

What makes scale difficult

Strong fundamentals and scalable technology do not guarantee easy execution. As one operator told us, “Everyone likes the underlying trends in youth sports, but it’s harder than it looks to build scale.” Several challenges stand out:

  • Fragmented go-to-market: Growth is labor-intensive, with real marginal cost to sell and support thousands of small, distributed clubs, leagues and organizers rather than a centralized buyer base.
  • Sport-specific credibility: Relationships, workflows and decision-makers differ by sport, making cross-sport expansion slower and more costly than a traditional software rollout.
  • Capital-intensive assets: Facilities and events can generate steady returns but require significant up-front investment and long payback periods unless paired with recurring-revenue layers.
  • Execution depth: Many organizations began as grassroots, mission-driven operations. As they scale, professionalized management, tighter processes and integrated systems that don’t disrupt local leadership and culture become increasingly important.

The investment case is clear: structural growth, rising spend per athlete and thousands of fragmented operators. The challenge is building platforms that scale across sports, geographies and business models.

Partner With L.E.K.

Whether you are evaluating a club management platform, exploring growth opportunities in facilities and programming, or developing a portfolio company go-to-market strategy, we bring the data, sector expertise and transactional experience to help you scale what’s next in youth sports.

For support evaluating investments in youth sports, contact L.E.K. Consulting’s Sports and Live Entertainment practice. Co-led by Managing Directors Alex Evans and Geoff McQueen in Los Angeles, this partner-led team works with investors, leagues, teams and service providers across the youth sports ecosystem.

L.E.K. Consulting is a registered trademark of L.E.K. Consulting LLC. All other products and brands mentioned in this document are properties of their respective owners. © 2026 L.E.K. Consulting LLC 

English

Critical Trends in Cardiovascular Medtech — Are We at an Inflection Point?

February 27, 2026

The cardiovascular (CV) segment is one of medtech’s largest and most strategically important arenas. CV is consistently among the largest therapeutic segments and sits at the center of high-acuity, high-cost care pathways (cath lab, hybrid operating room, remote monitoring, etc.). This combination of clinical burden, procedural intensity and capital utilization makes CV a disproportionate driver of value creation across the industry.

Yet CV is entering a period where technology leadership alone is no longer sufficient. Over the next three to five years, the most attractive growth and profit pools will accrue to companies that can enable higher throughput and safer procedures across constrained cath lab capacity, win in the shift of care to lower-cost outpatient settings and commercialize integrated portfolios that align with how health systems buy (i.e., illustrating clear return on investment (ROI) through cost of care and patient retention).

Underpinning all of this is a structural change in innovation: Breakthroughs are increasingly sourced from startups, while large strategics must excel at partnership, acquisition and scaled commercialization to supplement their existing portfolios.

The critical trends reshaping the sector can be segmented in terms of technology, care delivery and business model innovation. These seven trends are highlighted below with the strategic implications for manufacturers, providers and potential investors.

Image
Image

Technology trends

1. Imaging-therapy convergence is accelerating the shift from devices to procedure platforms

CV is moving toward a model where imaging is inseparable from intervention. The world of a preprocedure diagnostic procedure or step is evolving into real-time integrated imaging guidance that can help determine therapy choice, device size and procedural endpoints.

This is evident in structural heart imaging with an explosion of preprocedural diagnostic imaging, screening and planning software as well as visible within structural heart, coronary and peripheral vascular intraprocedural imaging (e.g., 3D intracardiac echocardiography, intravascular ultrasound (IVUS), intravascular optical coherence tomography (OCT)), physiological assessment and navigation tools increasingly defining procedural quality and optimizing cath lab capacity/procedure time.

Imaging innovation is driven by increasing clinical complexity and precision requirements, economic pressure to reduce complications and lengths of stay, and demand for reproducible results. As a result of imaging advancements, competitive differentiation is shifting from single-product superiority to end-to-end procedural ecosystems (i.e., planning, guidance, therapy, verification, follow-up). Winners will be players that can integrate imaging, software and therapy into a simple, repeatable workflow that improves both outcomes and throughput.

2. Artificial intelligence (AI) and enabling technologies will help reshape clinical decisions, lab throughput and commercialization

AI’s first wave in CV focused on image segmentation and interpretation. The next wave is likely more operationally disruptive: AI as a workflow orchestrator and procedural copilot, spanning scheduling optimization, case triage, automated reporting, complication prediction and intraprocedural decision support. The impact of AI is most likely to be felt in cath lab productivity increases, procedural guidance (i.e., device selection) and chronic management (e.g., remote monitoring, predictive alerts).

Winners in AI will need access to high-quality data at scale, integration into clinical workflows and regulatory/provider trust. Integrating AI into solutions has the potential to help accelerate the shift from transactional selling to recurring revenue models. While monetizing AI add-ons is a constant question, the decision to not integrate AI into offerings may have bigger consequences as the market rapidly evolves.

3. CV-specific robotic-assisted systems (RAS) will move from “nice to have” to an operational lever, if economics and workflow are solved

RAS in CV settings are advancing, with multiple strategics shifting focus from an early adoption phase to a future scaling phase, driven by the promise of precision, standardization and occupational health benefits (notably radiation reduction and ergonomic improvements). The long-term vision of remote or distributed expertise remains compelling, but near-term value will be determined by pragmatic workflow and ROI.

Manufacturers must solve the challenges around workflow integration (reduced cognitive load and procedure time), utilization (sufficient case volume) and interoperability. There are numerous RAS players interested in the CV market, as well as CV players interested in bringing RAS into the cath lab. The technical challenges will be solved, and the future opportunity is up for grabs.

RAS are likely to become part of broader digital cath lab modernization programs. Device companies should treat robotics less as a discrete category and more as a capability embedded into integrated solutions — potentially paired with AI-driven navigation, imaging guidance and standardized procedure playbooks.

Care delivery trends

4. Cath lab capacity is becoming a binding constraint — and a major source of competitive advantage

Demand continues to rise (aging populations, broader indications, improved diagnostics) and case complexity is increasing, while cath lab capacity faces pressure from staffing supply shortages (across interventional cardiologists, electrophysiologists, technicians, nurses), increased documentation burdens and increased operational expectations (e.g., room turnover).

Winners will deliver throughput improvement through workflow automation, procedure standardization and reduced complications, winning a disproportionate share by becoming a partner to constrained providers.

5. Outpatient shift: Ambulatory surgery centers (ASCs) and office-based labs (OBLs) are becoming strategic battlegrounds — now expanding into more complex CV and electrophysiology

Economic pressure from payers and health systems is steadily moving cases away from inpatient settings (e.g., the recent approval of cardiac ablation in ASCs). ASCs and OBLs are both highly important in this shift in care setting. Different settings create new call points that have unique purchasing criteria and are starting from scratch in terms of capital equipment. Manufacturers need to be ready with a playbook and sales team to cater to the needs of these new sites of care or risk falling behind. This includes:

  • ASC-/OBL-specific product configurations and service bundles
  • Simplified training and credentialing support
  • Per-case pricing options and risk sharing tied to complications or reinterventions
  • Dedicated evidence that speaks to outpatient endpoints: time, discharge readiness, readmission and total cost

Business model trends

6. Portfolio selling in CV will intensify as providers buy pathways, not products

Health system consolidation, procedure complexity and integrated service lines are pushing CV procurement toward portfolio decisions. Providers increasingly prefer fewer strategic vendors that can cover a broad share of cases with consistent workflows, data integration and contracting simplicity as long as it does not compromise clinical outcomes or clinician satisfaction.

Vascular provides an earlier example in terms of offering a range of vessel visualization modalities (e.g., IVUS, OCT), vessel preparation devices (e.g., intravascular lithotripsy, specialty balloons, atherectomy) and treatment options (e.g., balloon vs. scaffold, drug-eluting bioresorbable stents vs. drug-eluting stents vs. bare-metal stents, drug-coated balloons vs. plain-old balloons).

Winners will craft compelling portfolio narratives linked to patient outcomes and efficiency, provide evidence for value analysis committees and integrate services that help operationalize change. Players with narrow portfolios will either need to become indispensable through overwhelming evidence and clinician pull or partner with other players to create a portfolio.

7. Business model innovation: Pricing, risk sharing and recurring revenue will move from experimentation to expectation

Traditional per-unit pricing is increasingly misaligned with provider economics — particularly in outpatient settings and under-bundled payment dynamics. Acceleration in alternative pricing models is expected:

  • Per-procedure pricing that bundles disposables, software and service
  • Subscription-as-a-service models for software, analytics and workflow tools
  • Outcome-linked arrangements (e.g., warranties, complication guarantees, reintervention-linked rebates)
  • Managed services for capital equipment and lab operation support with or without minimum device utilizations

To avoid margin erosion, companies must build pricing architectures that tie to measurable value — throughput, complication reduction, readmissions and total episode cost — supported by data and credible analytics.

Critical activities to stay ahead of key trends

With a number of critical trends shaping the CV industry, there are a number of key steps manufacturers can take to best position their portfolios for success:

  • Reframe strategy around procedures and sites of care: Define where you will win (inpatient, ASC, OBL) and tailor offerings accordingly to prioritize consistently predictable and efficient procedures for at-capacity customers.
  • Build a portfolio narrative with evidence: Not just clinical superiority but economic proof tied to outcomes and operational impact from leveraging the comprehensive portfolio.
  • Leverage strategic M&A to supplement core capabilities: Capture meaningful innovation from startups through early partnering and incubation, disciplined M&A and thoughtful integration.
  • Invest in the workflow layer: Data, AI, integration and services that unlock cath lab throughput and standardization.

In short, the CV industry is transitioning from a product arms race to a platform-and-economics competition. The next era will reward organizations that can converge imaging, therapy, AI and service into repeatable procedure success — delivered wherever the patient is treated, increasingly outside the hospital.

For more information, please contact us.

L.E.K. Consulting is a registered trademark of L.E.K. Consulting LLC. All other products and brands mentioned in this document are properties of their respective owners. © 2026 L.E.K. Consulting LLC

English

Education Pulse Survey: Priorities and Perspectives from K-12 and Higher Education Administrators

February 26, 2026

As the education sector faces an uncertain funding and regulatory environment, leaders are shifting from expansion to optimization. In a recent webinar, L.E.K. Partners Jitin Sethi and Laura Brookhiser explored how institutions are prioritizing spending and where investment momentum remains — from student well-being and teacher retention to AI-enabled instruction and operations.

L.E.K. Consulting is a registered trademark of L.E.K. Consulting LLC. All other products and brands mentioned in this document are properties of their respective owners. © 2026 L.E.K. Consulting LLC

English

Riding the Wave: Trends Shaping the Education Deals Landscape

February 26, 2026

The education sector continues to demonstrate strong resilience, marked by rising transaction volumes and increased global deal activity.

In this keynote snippet from EducationSummit2025, the discussion highlights a particularly robust year for education M&A, with growing investor confidence and sustained momentum across markets.

The session explores:

  • The rebound in transaction volumes
  • Increased private capital participation
  • Expanding activity across the education value chain
  • The broader outlook for the sector

Watch the video for concise insights into current market dynamics and what lies ahead for the global education landscape.

L.E.K. Consulting is a registered trademark of L.E.K. Consulting LLC. All other products and brands mentioned in this document are properties of their respective owners. © 2026 L.E.K. Consulting LLC

English

K-12 Outlook: Why the Fundamentals Still Hold Strong

February 27, 2026

In this second keynote session video from EducationSummit2025, the focus turns to the accelerating momentum in global education deal activity over the past 12–14 months.

The session explores how resilient K-12 fundamentals, increasing consolidation and the rise of regional education platforms are sustaining strong investor interest worldwide. From established operators to emerging growth platforms, capital continues to flow across key markets — including the GCC, APAC and India.

Key themes covered include:

  • The rebound and resilience of global education M&A
  • Consolidation trends across K-12 and adjacent segments
  • Growth of regional platforms and cross-border investor interest
  • Long-term structural drivers underpinning education demand

With demographic tailwinds, premiumization of schooling and increasing institutional participation, the outlook for education investment remains firmly positive.

Watch the session for strategic insights into market dynamics, M&A opportunities and the long-term growth forces shaping the global education landscape.

L.E.K. Consulting is a registered trademark of L.E.K. Consulting LLC. All other products and brands mentioned in this document are properties of their respective owners. © 2026 L.E.K. Consulting LLC

English
Image
Construction Software During a Recession: What Can We Expect? report cover
Special Report

Construction Software During a Recession: What Can We Expect?

February 25, 2026

Construction software has yet to be used during a “typical” recession.

These solutions support constructing and maintaining the built infrastructure across residential, commercial and infrastructure segments and have experienced increased adoption due to their productivity benefits. But they have not yet been tested in a “typical” downturn, raising an important question: How will they perform when the next recession hits?

Generally, construction software is associated with productivity and efficiency gains. However, the key issue during a recession is how different categories of software perform as construction activity slows. Performance will not be uniform: Demand is shaped as much by where activity persists across the construction life cycle as by overall construction volumes. Tools that directly support productivity and cost control can maintain momentum in a downturn, particularly as contractors look to offset labor constraints and protect margins.

Resilience will depend on how deeply a solution is embedded in everyday workflows, giving providers greater control over outcomes through design, pricing and deployment choices.

Download the full report to explore how construction software is likely to perform in a recession, and what companies can do now to prepare.

For more information, please contact us

L.E.K. Consulting is a registered trademark of L.E.K. Consulting LLC. All other products and brands mentioned in this document are properties of their respective owners. © 2026 L.E.K. Consulting LLC 

English
Subscribe to