2025 US Footwear and Apparel Brand Heat Index

May 1, 2025

L.E.K. Consulting’s latest Brand Heat Index report reveals the footwear and apparel brands gaining traction with consumers across demographics. In a market driven by rapidly shifting trends and preferences, brand strength has become a key differentiator — and a powerful lever for driving business value.

This year’s findings show that consumers are gravitating toward classic, iconic silhouettes that blend comfort with style. While established legacy brands continue to hold some of the top positions, emerging brands are gaining momentum across categories and demographics, challenging the dominance of industry stalwarts.

Explore our infographic to see which brands are rising — and which are cooling off — or download the full Brand Heat Index Special Report for deeper insights. 

brand heat index 2025


L.E.K. Consulting is a registered trademark of L.E.K. Consulting LLC. All other products and brands mentioned in this document are properties of their respective owners. © 2025 L.E.K. Consulting LLC

English
Executive Insights

Quantum Computing in Biopharma: Future Prospects and Strategic Insights

May 1, 2025

Key takeaways

Quantum computing (QC) in the pharmaceutical sector is transitioning from academic research to a specialist, pre-utility phase, with annual investments potentially reaching approximately $25 million for some pharmaceutical sponsors in the next five years.

The learning curve for QC is steep and talent is scarce, requiring organizations to build diverse teams for competitive advantage; both PharmaCos and QC companies must invest in innovative ecosystems to rapidly train and recruit qualified professionals.

The first applications of QC in pharmaceutical companies (PharmaCos) will likely be in discovery (including drug design and synthesis), clinical development and operations, the supply chain, and manufacturing; the near-term greatest advances are expected to be in hybrid workflows that integrate QC, artificial intelligence and classical computing. 

There are five key questions PharmaCo executives should ask themselves to ensure they are ready to capture the value of QC in their organization. 

Quantum computing — what can it do for biopharma?

Rising clinical thresholds, the growing need for complex drug modalities and extended development timelines are making novel molecular entities (NMEs) increasingly difficult to develop. The annual R&D spend per NME, from discovery to launch, is estimated at $1.5 billion-$3.5 billion, with annual R&D spend across the top 15 pharmaceutical companies (PharmaCos) growing roughly one and a half times since 2010 and projected to reach up to $18 billion by 2030.1 

Compounding this challenge, biopharma faces mounting pressure to accelerate innovation due to compressed product life cycles under the Inflation Reduction Act, and more than $200 billion in biopharma revenue is potentially at risk from loss of exclusivity by 2030.  

Could technological advances in artificial intelligence (AI) or quantum computing (QC) help address biopharma’s throughput and spending challenges? AI has seen explosive growth in the past five years, and QC is following suit, as evidenced by increasing publication trends (see Figure 1). QC leverages principles from quantum mechanics to process information exponentially faster than classical computing. The potential for QC and AI to revolutionize the biopharma industry together by offering unprecedented computational power and problem-solving capabilities is enormous.

Figure 1

Image
PubMed mentions of QC and AI (October 2000-2024)

Figure 1

Image
PubMed mentions of QC and AI (October 2000-2024)

To date, AI has seen significantly more investment due to its relative maturity, accessibility and market readiness. However, AI’s gain is not QC’s loss. QC and AI are complementary. QC can enable faster training of and inference from AI systems and brings an ability to process data in ways classical computers cannot. Through this it can unlock computational possibilities that are currently unobtainable.

Investment in QC has grown globally. Cumulative investment in the QC market is fueled by both the public and private sectors, totaling around $8 billion in the U.S., approximately $15 billion in China and about $14.3 billion across the U.K., France and Germany through 2024. While private investments in quantum technology have declined from COVID-19 highs due to tightening funding environments and higher interest rates ($2.3 billion worldwide private investment in 2022 versus around $1.3 billion in 2023), quantum intellectual property (IP) development over the past 10 years has increased significantly.

Beyond growth in investment and IP development, the capacity of quantum computers via qubits — the fundamental units of quantum information — has expanded dramatically. IBM progressed from a 5-qubit processor in 2016 to a 433-qubit processor in 2022, with plans to achieve more than 1,000 qubits in 2025. This advancement extends across the industry, with companies such as Google, IonQ and QuEra also demonstrating remarkable improvements in qubit capacity

What is quantum computing?

Quantum computing (QC) harnesses the principles of quantum mechanics to solve complex calculations beyond the capabilities of classical computers, representing a branch within the broader field of quantum science.

QC compared to quantum science and quantum mechanics

QC applies principles from quantum mechanics to process information in fundamentally new ways, enabling exponentially faster problem-solving for certain tasks compared to classical computers. It is an interdisciplinary field within quantum science, which broadly studies quantum phenomena across physics, chemistry and engineering. 

Quantum interference

A fundamental principle that enables QC to be successful is quantum interference, which emerges due to the wavelike nature of quantum particles. By combining the probability amplitudes of these waves to create patterns, quantum computers can process information uniquely.

Key aspects of quantum interference include:

  • Computational parallelism: Enables simultaneous evaluation of multiple solutions, making certain problems tractable
  • Precision enhancement: Amplifies correct solutions while suppressing errors, improving quantum sensing accuracy
  • Coherent control: Facilitates precise manipulation of quantum states for advanced quantum logic and circuits

Quantum interference underpins quantum advantage across computing, communication and sensing, offering new insights into information processing.

Quantum stack

Integrating quantum interference into quantum networking requires a structured quantum stack, which defines the hardware and software layers essential for scalable QC. 

Quantum stack overview

Enterprise-grade solution

Quantum networking 

  • Production grade is reliable, flexible and secure
  • Integrates seamlessly with customer’s production workflow
  • Rapid customer development and deployment 

Quantum networking connects quantum computers using quantum mechanics to surpass classical communication. By transmitting quantum states instead of binary data, these networks enable secure, high-performance distributed computing.

Potential benefits to biopharma from quantum networking include:

  • Secure transmission of clinical trial data/real-world data
  • Interoperability across pharma entities for collaboration  

Pioneering QC applications in drug discovery and clinical trials

QC has the potential to revolutionize the biopharma value chain by overcoming classical computing’s limitations in handling complex datasets and simulations (see Figure 2). The most impactful areas are expected to be in drug discovery and research. QC directly addresses the inherent limitations of classical computing in computer-aided drug design because molecules operate by quantum rules — their behavior fundamentally involves dealing with exponentially large-state spaces, which classical systems can only approximate at great computational cost. 

Quantum-enhanced generative models can also explore vast chemical spaces faster than classical techniques can, leading to the discovery of more novel drug candidates previously inaccessible for many years with classical computing, reducing R&D timelines, lowering costs and improving success rates. 

In clinical design and operations, QC can enhance patient stratification and trial optimization by analyzing complex genomic, biomarker and real-world patient data. Quantum machine learning can identify optimal patient subgroups for personalized medicine, reducing trial failures and improving efficacy predictions. Quantum optimization can also refine trial site selection and adaptive trial designs, increasing efficiency and reducing costs.

Beyond R&D, QC can drive efficiencies across other areas of the value chain. QC can help optimize manufacturing and supply chain processes, improve predictive analytics for commercial functions, and increase efficiency of operations to improve sustainability.

While still evolving, QC’s ability to tackle biopharma’s most computationally challenging problems could lead to groundbreaking efficiencies and transformative advancements. 

Figure 2

Six areas of biopharma capabilities for quantum technology use cases 

Image
Six areas of biopharma capabilities for quantum technology use cases

Figure 2

Six areas of biopharma capabilities for quantum technology use cases 

Image
Six areas of biopharma capabilities for quantum technology use cases

Emerging interest is driving QC into a pre-utility phase in biopharma

With these high-value QC use cases, it is not a surprise that an L.E.K. Consulting survey of roughly 300 U.S. and EU biopharma stakeholders indicated that over 90% of them are aware of QC and its potential. Additionally, about 50% of respondents, representing 110 unique biopharma companies, stated they understand key concepts and have had exposure to QC or have experience studying its applications (see Figure 3). 

Figure 3

Biopharma familiarity with QC 

Image
Biopharma familiarity with QC

Figure 3

Biopharma familiarity with QC 

Image
Biopharma familiarity with QC

Biopharma participants suggest that QC is making significant early strides, transitioning from academic research to a specialist, pre-utility phase. In this phase, there is a focus on developing practical algorithms and applications to lay groundwork to drive commercial value. Approximately 44% of biopharma stakeholders are in the “early majority,” awaiting evidence before integrating QC, while 30% are innovators or early adopters eager to drive innovation. Investment in QC is set to grow, with 50% of PharmaCos planning annual budgets of $2 million-$10 million and 20% expecting $11 million-$25 million over the next five years. This reflects a growing recognition of QC’s benefits (see Figure 4). 

Figure 4

Image
Biopharma expects to develop quantum capabilities by leveraging partnerships

Figure 4

Image
Biopharma expects to develop quantum capabilities by leveraging partnerships

PharmaCos are experimenting with QC applications across the pharmaceutical value chain, first focusing on drug discovery and clinical trials (see Figure 5).

Expansion of capabilities within sustainability, commercial operations, manufacturing and product development may also be enabled by QC technology. However, the exact impact and best-suited QC modalities for each use case are still being defined.

Recent key advances in QC lead to the need for biopharmas to engage with quantum processing units and enablers

Given the excitement and investment in the space, the landscape of QC is quickly evolving, marked by significant technological advances across the ecosystem. Major milestones from large tech players in 2024 include:

  • IBM’s launch of Quantum Heron, its most advanced quantum computer with 156 logical qubits
  • Google Quantum AI’s new Willow chip, which enables exponential error reduction and enhanced performance in superconducting quantum systems 

Figure 5

QC benefits across the value chain

Image
QC benefits across the value chain

Figure 5

QC benefits across the value chain

Image
QC benefits across the value chain

Pure-play QC players have also made substantial strides, including:

  • IonQ’s Tempo quantum computer achieving 99.9% 2-qubit gate fidelity, positioning the company as a leader in trapped-ion technology
  • Quantinuum’s achievement of 12 logical qubits with its system model H2, a threefold advance over previous models

With these advancements in QC, two key stakeholder groups are emerging: the quantum processing unit providers and the enablers that facilitate access to QC. These stakeholders drive momentum and funding for QC. Like engaging with AI players, biopharma stakeholders should proactively collaborate with these diverse QC ecosystem players to fully harness these technologies and stay competitive in this evolving field (see Figure 6). 

Figure 6

Growing number of new stakeholders in the evolving QC ecosystem 

Image
Growing number of new stakeholders in the evolving QC ecosystem

Figure 6

Growing number of new stakeholders in the evolving QC ecosystem 

Image
Growing number of new stakeholders in the evolving QC ecosystem

Strategic partnerships needed to compete within a specialized market

Due to the growing complexity of the QC ecosystem, successful integration of workflows depends on building capabilities through strategic partnerships. Notable collaborations include:

  • IBM Quantum with GSK, Moderna and AstraZeneca: Optimizing messenger RNA research and clinical data imputation using IBM’s Quantum Heron and Condor processors
  • Google Quantum with Boehringer Ingelheim: Exploring molecular simulation algorithms to aid in drug discovery with Google’s Sycamore processor

Partnerships underscore the industry’s commitment to integrating QC into pharmaceutical workflows, highlighting the collaborative efforts needed to overcome technical challenges and achieve utility (see Figure 7). Building in-house expertise and fostering external partnerships will be crucial to leverage necessary talent quickly. Companies that act swiftly will gain a competitive advantage, positioning themselves as leaders in this emerging field. 

Figure 7

Major pharma companies have established relationships with QC organizations 

Image
Major pharma companies have established relationships with QC organizations

Figure 7

Major pharma companies have established relationships with QC organizations 

Image
Major pharma companies have established relationships with QC organizations

The near-term impact: Intersection of QC, AI and classical computing

The most promising near-term advancement is combining QC with AI and classical computing in hybrid workflows. This combination leverages the strengths of all technologies, enabling more accurate simulations of complex systems, enhanced machine learning models and improved process optimization for larger datasets at significantly faster speeds. More than 70% of biopharma stakeholders anticipate that QC will augment classical computing and AI, offering more precise and efficient solutions, especially in navigating breakthroughs in drug discovery and development.

For example, Qubit Pharmaceuticals leverages QC for advanced target characterization and molecular dynamics within small-molecule drug discovery while simultaneously utilizing AI-driven generative modeling, virtual screening and predictive analytics. Additionally, Qubit has partnered with Pasqal to leverage both classical computing and QC to model proteins, NMEs and water molecules at high levels of accuracy. 

Further, IonQ’s collaboration with AstraZeneca includes the creation of an applications development center within AstraZeneca’s BioVentureHub to advance QC for drug discovery and development. In addition, IonQ has collaborated with NVIDIA, AstraZeneca and AWS to advance drug development using computational tools — achieving 20x speedups in molecular simulations versus AWS’ previous implementation — and paving the way for quantum-accelerated biopharma and materials science.

Further advancements, including running AI on quantum computers, are exciting but not expected to be seen for longer periods of time.

The path forward for QC in biopharma

The integration of QC into the pharmaceutical industry holds immense potential to revolutionize drug discovery and clinical trials. While QC represents a longer-term (five-to-10-year) strategic investment requiring scalable hardware, advanced error mitigation and correction, and specialized algorithms, the opportunities it presents are significant. QC can enhance predictive analytics, optimize clinical trial designs and expedite the discovery of novel therapies, ultimately accelerating drug development and reducing time to market for new treatments.

Despite current challenges such as talent acquisition and a steep learning curve, strategic investments, partnerships and AI integration can enable the industry to harness QC’s transformative power. Continued collaboration and innovation will be crucial.

Biopharma stakeholders should address the following key questions to effectively utilize QC’s benefits and remain competitive:

  • Does my organization have a clear plan on how to experiment with and deploy QC within key functions, especially R&D?
  • Within R&D, are there specific use cases that would be most appropriate for QC? On what basis should these be identified?
  • How do I balance external partnerships and collaborations alongside internal capabilities to accelerate realization of the potential from QC in R&D?
  • To implement QC effectively, what key internal operating model requirements must be met, specifically regarding talent, hardware, data infrastructure and software?
  • To what extent should QC be leveraged alongside AI? Is there a benefit from integrating early (e.g., hybrid workflows) or operating independently prior to integration? What is the optimum roadmap for my organization?

By considering these questions and investing strategically in QC, the pharmaceutical industry can harness new opportunities and achieve remarkable progress across drug discovery, clinical development and operation, the supply chain, and manufacturing.

Note: L.E.K. conducted a number of interviews with both AI and pharma experts including Google, IONQ, Qubit and others to help triangulate and inform the findings.

For more information, please contact us.

L.E.K. Consulting is a registered trademark of L.E.K. Consulting LLC. All other products and brands mentioned in this document are properties of their respective owners. © 2025 L.E.K. Consulting LLC

Endnote
1L.E.K. analysis of Evaluate Pharma. 

Questions about our latest thinking?

English

Manufacturing Strategy and Procurement Value Creation for a Medtech Company

May 1, 2025

Background and challenges

A global medical device manufacturer had experienced a significant “pull forward” of capital product sales during the COVID-19 pandemic that resulted in stunted demand and revenue in the following years. COVID-19-related commodity dynamics impacted cost, further compressing margins.

Management engaged L.E.K. Consulting to perform a thorough assessment of the company’s strategic and operational options to return to profitable growth in the near term. We completed a cost optimization assessment, with a focus on manufacturing, procurement and working capital.

Approach

The L.E.K. team employed its operations and supply chain expertise to identify opportunities, model value and develop a roadmap to improve profitability. Three opportunities were identified and developed with the management team: manufacturing strategy, indirect procurement and working capital.

Manufacturing strategy

The company’s manufacturing strategy was inflexible, with long lead times, high costs and significant geopolitical risk. The company still relied on an outsourcing model primarily based in China. Competitors had successfully transitioned to Mexico and the US over the last ten years. Competitors also had more operational flexibility, with a mix of owned manufacturing and electronic contract manufacturing (ECM) partners.  

First-administration Trump-era tariffs had broadly been passed along to customers in the market, but competitors who had nearshored or re-shored were enjoying margin uplift.

A new operations leadership team wanted to undertake a nearshoring transformation but had not yet developed the strategy or quantified the margin uplift. The L.E.K. team completed a rapid manufacturing footprint optimization study, including:

  • Market research into peer and analog manufacturing strategies
  • A business case to model financial benefits and one-time costs
  • A sensitivity analysis of forecasted demand and impact on the business case
  • Global ECM market research to identify potential partners, with a focus on Mexico and Southeast Asia
  • Opportunities to leverage ECM capabilities, simplify manufacturing processes and reduce costs were identified and developed

Indirect procurement

The company had an established corporate supply chain team that managed its direct and logistics spend but had not centralized its indirect procurement. The indirect procurement team had less than a third of indirect spend under management and did not have spend visibility or a productivity pipeline.

The L.E.K. team deployed L.E.K.’s Rapid Sourcing Diagnostic solution to develop a perspective on spend, savings opportunities and strategic sourcing levers.  

  • A spend cube was developed to categorize spend, evaluate category complexity and develop supply chain opportunities  
  • A contract review was completed to evaluate commercial terms and identify constraints  
  • Business stakeholders were interviewed to understand how categories and suppliers had historically been managed  
  • Category savings estimates and sourcing levers were developed through L.E.K. team-led workshops and value analytics  

Working capital

In addition to cost pressure, the company lagged peers in its cash conversion cycle (CCC), which was driven by differentiated peer revenue models and a lack of focus on working capital management with suppliers and customers.

Our team deployed L.E.K.’s Rapid Working Capital Assessment to benchmark the company to its peers and develop a set of opportunities to improve its cash position:

  • Payables, inventory and receivables were benchmarked to peers and analogs
  • The company achieving median and top quartile performance were modeled for cash and P&L impact  
  • Current collections and payables processes were evaluated to identify operational changes that could improve working capital performance  
  • Market research was conducted to identify peer and analog standard terms, revenue models and business process improvements
  • A set of opportunities to improve working capital position was developed  

Results

Working closely with the client leadership team, the L.E.K. team developed an integrated operations performance improvement program that included both rapid, near-term opportunities and strategic projects to be executed over a five-year horizon:  

  • $60 million in annual cost savings, tripling earnings before interest, taxes, depreciation and amortization
  • 40% of savings generated through indirect procurement on a one-year horizon
  • 30% increase in cash through working capital unlocks

For more information, please contact us.

L.E.K. Consulting is a registered trademark of L.E.K. Consulting LLC. All other products and brands mentioned in this document are properties of their respective owners. © 2025 L.E.K. Consulting LLC

English

Operational Due Diligence: Supply Chain Synergy and Operational Health Check for a Nutraceutical Target

May 1, 2025

Background and challenges

A nutraceutical company was considering a strategic investment to expand into new product categories. The new product categories appealed to a younger demographic and would expand its direct-to-consumer (DTC) business, both critical strategies for the business.

L.E.K. Consulting was engaged in an operational due diligence (ODD) to develop a perspective on synergies and risk across the end-to-end supply chain. The three-week due diligence included a risk assessment, estimated synergy cost savings and a time-phased implementation plan. In parallel, we executed a commercial due diligence (CDD) to evaluate the competitive landscape and risks the company faced with a planned expansion from DTC to retail.

Approach

L.E.K. deployed its Synergy Assessment and Operational Health Check solutions to rapidly evaluate the company’s and the target’s supply chain and manufacturing capabilities.

Six synergies were developed that would generate 810 basis points of gross margin improvement for the target, as well as 30 basis points for the company:

  1. Consolidate the target’s manufacturing to the company’s high-performance contract manufacturers to reduce conversion costs  
  2. Insource a set of product lines to the company’s internal manufacturing platform to take advantage of a differentiated cost structure  
  3. Leverage packaging economies of scale with the company’s existing supply base and transition to new packaging design to reduce cost and working capital
  4. Capitalize on combined parcel spend and new cost optimization strategies  
  5. Insource the target’s DTC distribution to leverage the company’s capabilities and capacity  
  6. Change supplier ordering processes to maximize inbound truckload utilization

A phased implementation plan was developed to accelerate speed to value while balancing business and broader integration priorities.  

The Operational Health Check focused on the target’s contract manufacturers, supply chain practices and key raw materials markets. No red flags were identified within the target’s operations. There were challenges with the primary ingredient used in most of the portfolio. The commodity market for this ingredient was experiencing high demand and global shortages that led to volatility in pricing and availability.  

In parallel, the CDD found significant pricing headwinds with major retailers due to changing consumer expectations. The target had little pricing power relative to its peers and a volatile commodity input, neither of which were accounted for in the business case.  

Results

Our team’s Synergy Assessment found a multimillion-dollar margin uplift opportunity for the target, which was nearly twice the initial company estimate. The analysis also found freight synergies for the acquiring company that had not previously been considered.  

The integration of the CDD and ODD was critical to the decision-making process for management. The combination of customer pricing pressure, direct materials volatility and the company’s position in the market led to an acquisition target that was much riskier than it initially appeared.  This critical insight led to further due diligence by the company and ultimately the choice not to move forward with the acquisition, potentially saving the client millions of dollars from a poor investment.

For more information, please contact us.

L.E.K. Consulting is a registered trademark of L.E.K. Consulting LLC. All other products and brands mentioned in this document are properties of their respective owners. © 2025 L.E.K. Consulting LLC 

English
Executive Insights

Targeting Geographies for Residential Services Growth

April 28, 2025

Key takeaways

Geographic growth is a key component of many residential services providers’ investment theses.

Each residential services business needs to pinpoint the demographic/macro and competitive/operational factors that make a market “good” for its business.

In an increasingly competitive market, chasing the most obvious metros and geographies may not be the best approach.

Using a geographic targeting index, L.E.K. Consulting was able to help one residential and commercial services provider prioritize a near-term pipeline of 10-15 new markets that would provide access to an additional $1.2 billion to $1.4 billion in market demand.

For many providers of residential services such as roofing, restoration, HVAC, landscaping and more, geographic growth is a key component of their expansion theses. But while many such businesses target the obvious markets — namely, larger metros with above-average income and/or population growth — a more precise approach is needed to unearth the less obvious, and potentially more lucrative, opportunities for both M&A and greenfield expansion. For example, L.E.K. Consulting recently worked with a client that found its business performed best in markets with lower home values but higher income and used that information as the basis for its expansion strategy.

To start, residential services providers that are looking to expand their platforms need to develop an index of what drives demand for their services. Dozens or even hundreds of variables can be evaluated using data science techniques to assess the market potential for building services in regions across the U.S. and serve as catalysts for more-targeted growth and sales efforts. 

Targeting local opportunities is critical, as variations in financial capacity, service demand and operational attractiveness are what propel increased residential remove- and-replace spending in specific areas. Granular analysis, meanwhile, can highlight both in-fill opportunities in existing markets and attractive subregions in potential expansion markets.

Core elements of a geographic targeting index

Every provider of residential services needs to develop its own index of the variables that it deems most important to the business. And while every residential services business is different, all their variables will fall into one of three essential categories, which can be identified by answering one or more related questions:

  1. Demand — What are the key drivers of demand for the specific residential service: home age, home sales, weather and/or other local factors?
  2. Financial capacity — To what extent does the geography feature homeowners with the growing means to pay for residential services?
  3. Operations — To what extent does the geography allow a residential services business to act on demand drivers and serve homeowners with the ability to pay? How dense (i.e., within easy access) are the properties that would be served? What level of competition and execution barriers does the geography have?

A composite of prior approaches used by residential services providers surfaces some common variables (see Figure 1). 

Figure 1

Residential example attractiveness paradigm 

Image
Residential example attractiveness paradigm

Figure 1

Residential example attractiveness paradigm 

Image
Residential example attractiveness paradigm

Applying these variables to assess metropolitan statistical areas across the U.S. makes clear that attractive growth geographies exist in multiple markets (see Figure 2). 

Figure 2

Residential example target geographies 

Image
Residential example target geographies

Figure 2

Residential example target geographies 

Image
Residential example target geographies

A review of specific geographies reveals opportunities within metros, all the way down to the ZIP code level (see Figure 3). 

Figure 3

US residential services attractiveness, by ZIP code (2024) 

Image
US residential services attractiveness, by ZIP code (2024)

Figure 3

US residential services attractiveness, by ZIP code (2024) 

Image
US residential services attractiveness, by ZIP code (2024)

The map surfaces some important findings and actionable insights. To start, there are 132 geographies that are 75-plus on the 1-100 attractiveness rating scale, representing an estimated 79 million people — roughly 24% of the total U.S. population. Unsurprisingly, the most attractive geographies are in the South: The South Census Region accounts for 38% of these geographies and contains 41% of the overall population living in attractive geographies (see Figure 4). 

Figure 4

US residential services attractiveness, by Census region (2024) 

Image
US residential services attractiveness, by Census region (2024)

Figure 4

US residential services attractiveness, by Census region (2024) 

Image
US residential services attractiveness, by Census region (2024)

That said, even within regions one will find a wide variety of geographies, both attractive and unattractive. For example, while the South Census Region contains the most attractive geographies, the East South Central Division contains just 4% of the population living in those attractive geographies (see Figure 5). 

Figure 5

US residential services attractiveness, by Census division (2024)

Image
US residential services attractiveness, by Census division (2024)

Figure 5

US residential services attractiveness, by Census division (2024)

Image
US residential services attractiveness, by Census division (2024)

Similarly, when analyzing attractiveness at the state level, pockets of opportunity can be found across regions.

Notably, population does not equal attractiveness. Some states have a comparatively lower population but a high level of attractiveness, whereas some higher-population states have a low level of attractiveness. Roughly 2 million people live in attractive geographies in Alabama, for example, which is a comparatively lower-population state given its population of about 5 million people (see Figure 6). 

Figure 6

US residential services attractiveness, by state (2024)

Image
US residential services attractiveness, by state (2024)

Figure 6

US residential services attractiveness, by state (2024)

Image
US residential services attractiveness, by state (2024)

And attractive geographies are not all urban. While urban geographies tend to skew toward higher attractiveness, opportunity still exists in more-rural regions. For example, some 40 million people live in rural geographies that score 50-plus on the attractiveness rating scale (see Figure 7).

Figure 7

US residential attractiveness, by urban, suburban and rural regions (2024) 

Image
US residential attractiveness, by urban, suburban and rural regions (2024)

Figure 7

US residential attractiveness, by urban, suburban and rural regions (2024) 

Image
US residential attractiveness, by urban, suburban and rural regions (2024)

How to create a geographic targeting index

While the above analysis is based on a set of variables that are relevant to most residential services businesses, each business will want to develop its own index.

For example, a services provider might find that an effective predictor of a successful geography for its business is the percentage of the population that’s enrolled in K-12 versus the U.S. average. The provider can then compare that metric against the geographic attractiveness index (see Figure 8). 

Figure 8

Total K-12 population vs. attractiveness (2024) 

Image
Total K-12 population vs. attractiveness (2024)

Figure 8

Total K-12 population vs. attractiveness (2024) 

Image
Total K-12 population vs. attractiveness (2024)

Once again, the analysis shows that while wealthy geographies score higher, but there is still promise in lower-income areas. (see Figure 9).

Figure 9

Wealth distribution in attractive areas (2024) 

Image
Wealth distribution in attractive areas (2024)

Figure 9

Wealth distribution in attractive areas (2024) 

Image
Wealth distribution in attractive areas (2024)

In another example, a services provider might be most interested in an older and more financially stable population, which aligns best with the provider’s current go-to-market approach. Population growth in the 55-plus bracket highlights clear pockets of opportunity, most acutely in the South (see Figure 10). 

Figure 10

US age 55-plus population growth by territory (2024-2034F) 

Image
US age 55-plus population growth by territory (2024-2034F)

Figure 10

US age 55-plus population growth by territory (2024-2034F) 

Image
US age 55-plus population growth by territory (2024-2034F)
But when overlaid with key financial stability metrics (e.g. , credit score, share of home equity), it becomes clearer that the opportunity is most pronounced in Florida (see Figures 11 and Figure 12).

Figure 11

US average credit score by territory (2024) 

Image
US average credit score by territory (2024)

Figure 11

US average credit score by territory (2024) 

Image
US average credit score by territory (2024)

Figure 12

US share of home value as equity by territory (2024)

Image
US share of home value as equity by territory (2024)

Figure 12

US share of home value as equity by territory (2024)

Image
US share of home value as equity by territory (2024)

A geographic targeting index in action

We worked with a residential and commercial services company that provides a building repair service and had used geographic analysis to target rural markets, specifically those close to distribution centers that would give it faster access to its installation product.

As we quickly identified, the company’s then-current footprint captured only 19% of demand; there was significant white space left over.

In order to evaluate areas into which the client could expand its services, we performed a robust regression analysis to identify new markets with attributes similar to those of its highest-performing existing markets. In doing so, we discovered that our client performed best in high-income markets with lower median housing values, low vacancy rates and a high concentration of suburban families with young children. We subsequently determined which of these attractive markets were within a reasonable drive time from the company’s regional headquarters and its suppliers’ distribution centers.

With our help, our client was able to prioritize a near-term pipeline of 10-15 new markets that would give it access to an additional $1.2 billion to $1.4 billion in market demand. We also built out a longer-term pipeline of markets that added an incremental $3.5 billion to $4 billion in market access for the company.

As a result of our work, our client has already started entering these new markets with a lot of success, and is considering opening new regional headquarters to help facilitate its entry into markets in other parts of the country.

The world is only getting more competitive, and the residential services space is no exception. That’s why, for providers of residential services, geo-targeting is a necessary component of growth. Getting smarter on data can help companies find the right target in a market that may otherwise not be appreciated.

For more information, please contact us.

L.E.K. Consulting is a registered trademark of L.E.K. Consulting LLC. All other products and brands mentioned in this document are properties of their respective owners. © 2025 L.E.K. Consulting LLC 

Questions about our latest thinking?

English
Executive Insights

The Streaming War for National Sports Rights

April 28, 2025

Key takeaways

Streaming platforms are doubling down on live sports, with media companies projected to spend about $33 billion on national sports rights in 2025.

Leagues are increasingly carving up media rights into separate packages to engage a broader set of bidders — driving more fragmented distribution even as exclusivity remains a core principle.

Live sports content is a major driver of subscriber growth, with events like the Super Bowl and the Olympics generating record sign-ups. 

Ad-supported streaming is fueling sports investment, as platforms capitalize on premium ad revenue and increased engagement. 

For decades, live sports have been the backbone of media giants, commanding prime-time audiences and premium ad dollars. As more live sports content becomes available via streaming — both from traditional broadcasters repurposing it to differentiate their digital platforms and from streamers aggressively entering the space — viewers are increasingly cutting the pay TV cord.  

This shift is accelerating the decline of pay TV subscriptions and prompting media companies to double down on streaming investments. In 2025, these companies are expected to spend approximately $33 billion on national sports rights, with streamers nearly doubling their stake to $7.1 billion since 2023.

Advertisers are following, reallocating budgets from linear TV to YouTube and connected TV, where targeting and engagement drive superior returns. Live sports represent a substantial advertising opportunity for streamers positioning themselves as the next hub for premium sports content.

As streaming giants ramp up their investment in live sports, the battle for media rights is transforming how games are distributed, monetized and consumed — redrawing the sports broadcasting landscape.

The streaming playbook for dominating live sports

Live sports have long been the backbone of TV advertising, accounting for 30%-40% of all linear TV national ad spend — a figure that is increasingly shifting toward streaming. At the same time, ad-supported streaming tiers are transforming content monetization, with the share of U.S. premium subscription video on demand (SVOD) subscriptions on ad-supported plans surging from 31% to 45% since 2022 (see Figure 1).

Figure 1

Share of premium SVOD* subscriptions by plan tier (US), 2022 vs. 2024 

Image
Share of premium SVOD* subscriptions by plan tier (US), 2022 vs. 2024

Figure 1

Share of premium SVOD* subscriptions by plan tier (US), 2022 vs. 2024 

Image
Share of premium SVOD* subscriptions by plan tier (US), 2022 vs. 2024

The convergence of these trends creates a powerful monetization opportunity. Live sports tend to drive viewership that’s incremental to scripted TV and film content, helping platforms capture attention that might otherwise go to YouTube, TikTok or other nonstreaming activities. When live sports are unavailable, 62% of fans shift their attention outside streaming platforms entirely, with that number climbing to 79% among younger viewers (see Figure 2). 

Figure 2

Reallocation of time spent watching sports content in the absence of live sports 

Image
Reallocation of time spent watching sports content in the absence of live sports

Figure 2

Reallocation of time spent watching sports content in the absence of live sports 

Image
Reallocation of time spent watching sports content in the absence of live sports

Live sports became a key driver of subscriber growth in 2024, as streaming networks saw record sign-ups from marquee events. Massive moments like the Super Bowl, Jake Paul vs. Mike Tyson and the Paris 2024 Olympics brought in millions of new streaming subscribers, reinforcing the unmatched acquisition power of live sports (see Figure 3). 

Figure 3

New subscriber sign-ups by live sports event 

Image
New subscriber sign-ups by live sports event

Figure 3

New subscriber sign-ups by live sports event 

Image
New subscriber sign-ups by live sports event

This unique audience behavior makes sports content a strategic powerhouse for streaming platforms — driving incremental viewing hours, attracting premium advertising dollars, improving retention among churn-prone demographics and driving new subscriber acquisition.

The high-stakes battle for media rights

With these incentives in play, media negotiations are heating up as several major sports rights deals near expiration. This next rights cycle will redefine the economics of sports broadcasting for years to come (see Figure 4). 

Figure 4

Major sports media rights deals set to expire (2025-30) 

Image
Major sports media rights deals set to expire (2025-30)

Figure 4

Major sports media rights deals set to expire (2025-30) 

Image
Major sports media rights deals set to expire (2025-30)

For properties like UFC and Formula One, which have seen significant audience growth, these negotiations represent an opportunity to substantially increase their valuations while potentially exploring new distribution models that span both traditional and streaming platforms.

UFC’s current media rights deal with ESPN, valued at about $500 million annually, is set to expire in 2025. UFC is reportedly seeking a $1 billion annual contract — more than double what Disney-owned ESPN is currently paying. ESPN holds exclusive negotiating rights until April 2025 and remains the front-runner, but it could face pressure from other bidders as UFC’s viewership and pay-per-view (PPV) sales continue to grow. If ESPN fails to renew, it risks losing one of its most valuable retention-driving properties on its streaming service, ESPN+.

The NFL’s upcoming media rights negotiations, while still several years away, will be among the most consequential in sports. When the league secured its current deal, it was celebrated as a landmark agreement. Now, after the NBA locked in a $7.5 billion-per-year deal despite ratings challenges, the NFL — still the undisputed ratings leader — is poised to command even higher fees. The league hasn’t ruled out the possibility of revisiting its CBS deal in light of Skydance’s pending merger with Paramount, which could unlock additional value.

Case studies in sports media value: UFC vs. MLB

UFC and MLB illustrate contrasting fates in the streaming era — one is thriving as a retention driver while the other struggles to justify its value.

UFC: The premium retention driver

UFC’s unique model — combining weekly fight cards with exclusive PPV events — makes it both a subscriber acquisition engine and a powerful churn mitigation tool. L.E.K. Consulting’s 2025 Sports Survey reveals UFC content is critically important to ESPN+ subscribers, with avid MMA fans 2.8x more likely to cancel their subscriptions if UFC content disappeared (see Figure 5). 

Figure 5

Likelihood to cancel ESPN+ if UFC content was no longer available 

Image
Likelihood to cancel ESPN+ if UFC content was no longer available

Figure 5

Likelihood to cancel ESPN+ if UFC content was no longer available 

Image
Likelihood to cancel ESPN+ if UFC content was no longer available

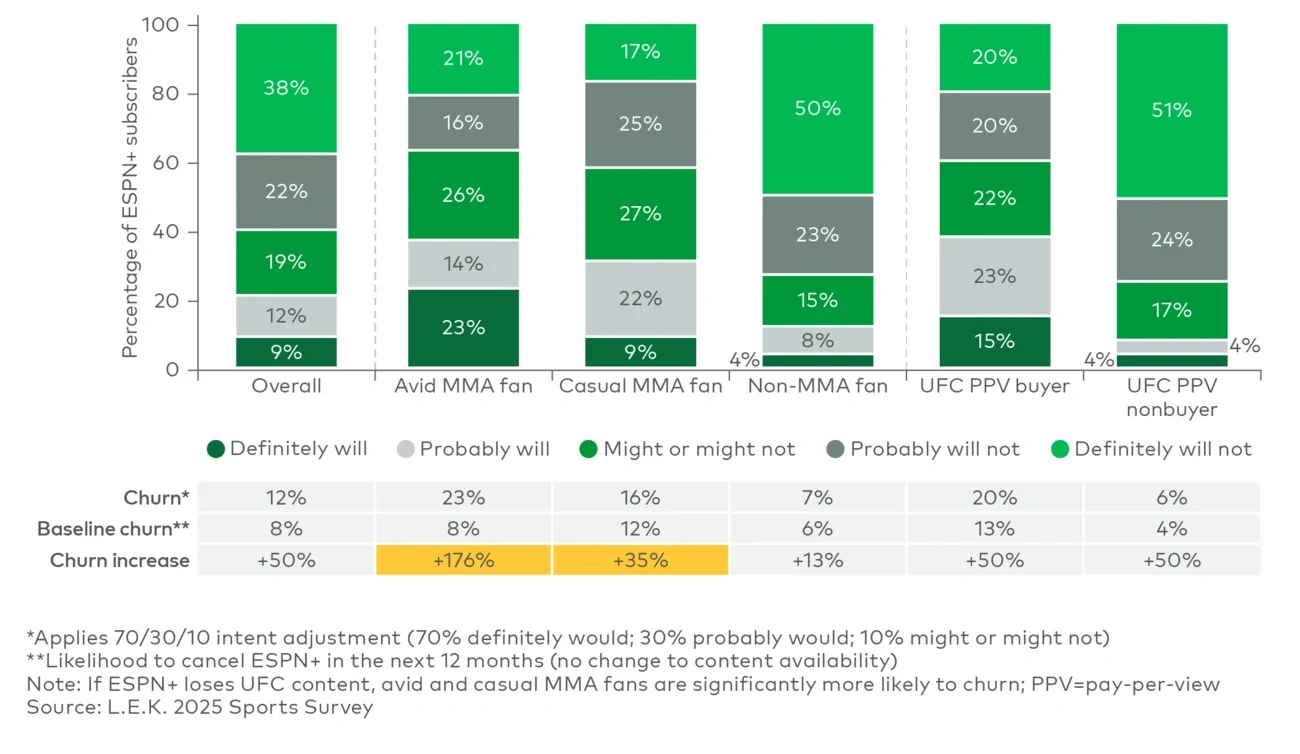
Avid MMA fans — who represent 21% of ESPN+ subscribers — stated they purchase an average of 3.5 UFC PPV events annually, according to our 2025 Sports Survey. Another 17% of subscribers are casual MMA fans, purchasing around 1.5 events per year, compared to just 0.8 events for nonfans. While ESPN remains the front-runner for UFC’s domestic rights, other potential bidders are in the mix. Warner Bros. Discovery’s B/R Sports is often cited as a contender, though its existing relationship with All Elite Wrestling could complicate a deal with TKO-owned UFC.

Netflix has also been mentioned as a potential partner for UFC, especially given its recent World Wrestling Entertainment agreement. However, in our estimation, the high price tag and PPV distribution model make it unlikely that Netflix will be a serious contender for UFC’s domestic rights. UFC’s international rights, however, are a more natural fit — Netflix’s global footprint makes it an ideal partner to consolidate fragmented rights, improve international monetization and accelerate UFC’s overseas audience growth.

MLB: The declining value proposition

ESPN’s decision to opt out of MLB’s national rights underscores the sport’s challenges at the national level in the streaming era. While interest in local teams and regional broadcasts remains relatively strong, national ratings have declined approximately 3% annually since 2013. At the same time, the ESPN/MLB rights deal was relatively expensive — with an estimated cost per viewer hour of $2.74 — materially higher than other recent agreements.

Meanwhile, newer entrants like Apple TV and Roku are paying significantly less in total for meaningful regular season content. Apple holds rights to Friday Night Baseball, while Roku airs Sunday Leadoff Baseball — both featuring one game per week over roughly 18 weeks from May through early September. These pricing disparities highlight the sport’s uncertain value at a national level, especially as platforms prioritize content that drives engagement and retention.

With the national rights picture in flux and the regional sports network (RSN) model continuing to erode, MLB teams are increasingly exploring alternative distribution strategies, including direct-to-consumer and over-the-air options. These models may improve access and exposure but currently generate far less revenue than legacy RSN deals do.

(Stay tuned for part two of this series, where we’ll explore the collapse of RSNs and the shifting dynamics of the local sports media ecosystem.)

A fragmented sports media landscape ahead

As the sports media ecosystem continues to fragment, several critical implications are emerging for both platforms and leagues:

  • Live sports are foundational. Streaming platforms that lack marquee sports content risk losing audience share to competitors that invest in tentpole events and use them to anchor subscriber growth and retention.
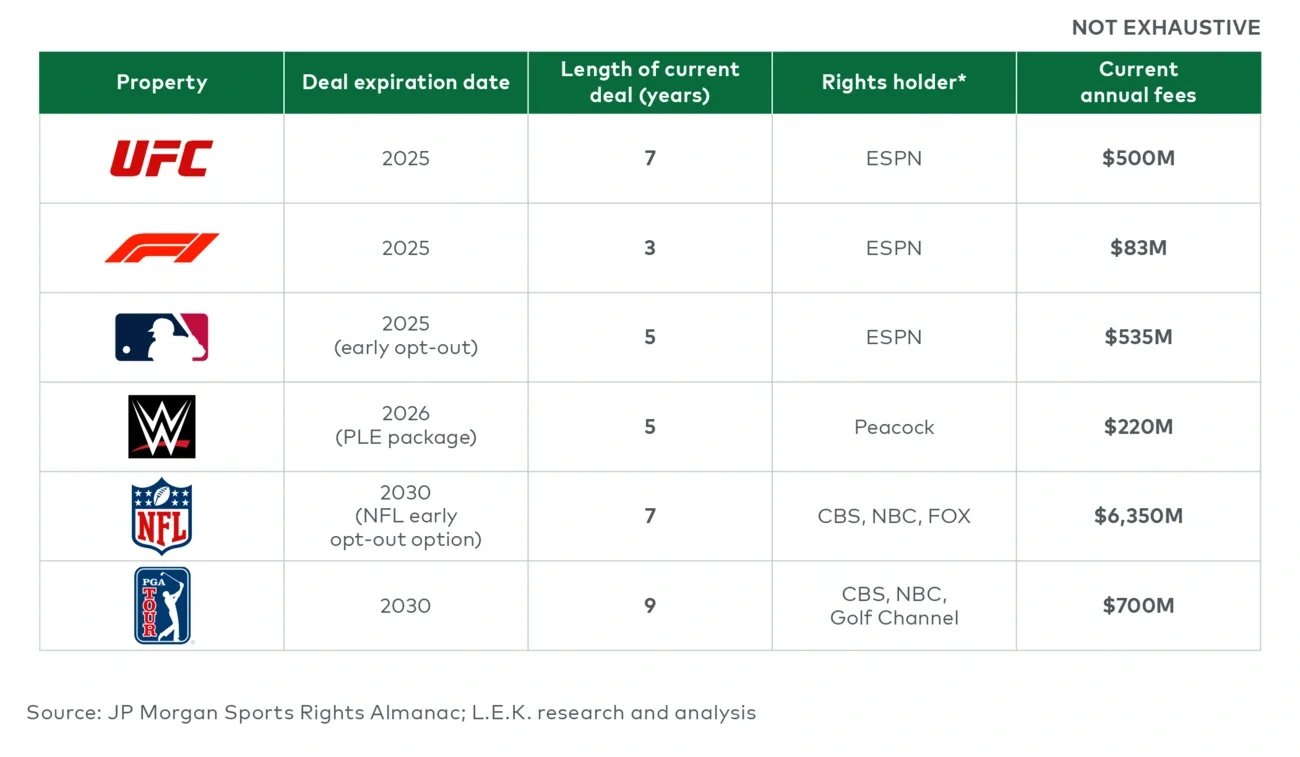
  • Leagues hold near-term leverage — but it may not last. Fast-growing, globally appealing leagues like UFC and Formula One are well positioned to drive meaningful increases in average annual value during this rights cycle. But as the market shifts fully to streaming, that pricing power may fade — especially with slowing subscriber growth or platform consolidation.
  • For fans, fragmentation is a mixed bag. As sports content splits across multiple platforms, access becomes more complicated, and subscription costs may rise. Yet fans also benefit from more flexible viewing options and the potential for richer, more personalized experiences.

These shifts signal a new era in sports broadcasting — one defined not by a single dominant platform, but by a dynamic, multichannel marketplace shaped by shifting economics, evolving fan behavior and high-stakes content decisions.

Coming next

The fragmentation of national rights is only part of the story. The collapse of RSNs presents an even greater challenge, as leagues and teams work to replace billions in lost revenue. In our next article, we’ll examine how the decline of pay TV is reshaping local sports broadcasting — and what it means for the future of regional media rights.

For deeper insights into sports media rights, platform strategy and content monetization, reach out to L.E.K.’s Media & Entertainment practice. Our team specializes in sports and live entertainment, direct-to-consumer models and media rights negotiations — helping clients navigate the evolving sports landscape with data-driven strategies.

For more information, please contact us.

L.E.K. Consulting is a registered trademark of L.E.K. Consulting LLC. All other products and brands mentioned in this document are properties of their respective owners. © 2025 L.E.K. Consulting LLC 

Questions about our latest thinking?

English
Executive Insights

When Is It Too Late? Drivers of Commercial Performance for Late Entrants in Biopharma

April 28, 2025

Key takeaways

Second or later entrants in the U.S. market are more likely to achieve commercial success if launched within two years of the first-in-class product.

Large pharmaceutical companies are better positioned to succeed with late entrants, leveraging their scale, experience and resources to compete commercially and manage the product life cycle.

Entrants launching beyond the two-year window can still be successful but almost always demonstrate clinically meaningful advantages in efficacy and/or safety to compete effectively. 

For executives pursuing a late-market entry, success depends on accelerating time to market and clearly differentiating the product. Without meaningful advantages and sufficient resources, the window of opportunity can close quickly. 

Introduction

While first-to-market biopharma products in a new therapeutic class are often seen as having a clear competitive advantage, recent trends tell a more nuanced story.

Over the past decade, around half of all innovative branded biopharma launches have been second or later entrants within their therapeutic class (late entrants). Some have successfully reshaped the standard of care — offering superior efficacy, safety and/or convenience — and have achieved strong commercial performance. Others, however, have struggled to gain traction, falling short of expectations with disappointing sales and minimal market impact.

As competition within therapeutic classes intensifies, critical questions emerge: When does it make strategic sense to develop a late entrant — and when is it simply too late? More importantly, what factors determine success for those entering an already-crowded field?

Followers fare better within two years of first launch

In the first two years following the launch of a new therapeutic class, the treatment landscape remains fluid, with physician adoption still evolving. This period offers fast followers — those entering the market within two years after the first-in-class entrant — a strategic window to capitalize on market dynamics and shape prescribing habits. With a stronger clinical profile, fast followers can capture substantial market share and, in some cases, even outperform the first-in- class entrant.

As time passes, physician and patient familiarity and comfort with early entrants tend to deepen, leading to entrenched prescribing habits and growing loyalty to established brands. This creates a high barrier to entry for later competitors, which must offer a clearly differentiated value proposition to displace existing treatments. As a result, fast followers outperform late followers significantly, achieving nearly three times the average sales (see Figure 1). This performance gap underscores the importance of timing, strategic positioning and rapid execution in competitive therapeutic classes. 

Figure 1

US sales of late entrants in year five post-FDA approval (2012-2023 FDA approvals) 

Image
US sales of late entrants in year five post-FDA approval (2012-2023 FDA approvals)

Figure 1

US sales of late entrants in year five post-FDA approval (2012-2023 FDA approvals) 

Image
US sales of late entrants in year five post-FDA approval (2012-2023 FDA approvals)

Differentiation can drive success for late entrants

Despite the well-known challenges of entering the market behind a first-in-class agent, there are notable success stories. Among the 189 late entrants analyzed, 18 achieved over $1 billion in U.S. sales within five years of launch and 22 outperformed order-of-entry-based sales expectations relative to the first-in-class product.1,2 

Most of the high-performing followers shared a common trait: a clearly superior efficacy and/or safety profile compared to the first entrant, highlighting the critical role of meaningful clinical differentiation in overcoming the disadvantages of later entry (see Figure 2). 

Figure 2

Clinical differentiation of products outperforming the first entrant (2012-2023 FDA approvals) 

Image
Clinical differentiation of products outperforming the first entrant (2012-2023 FDA approvals)

Figure 2

Clinical differentiation of products outperforming the first entrant (2012-2023 FDA approvals) 

Image
Clinical differentiation of products outperforming the first entrant (2012-2023 FDA approvals)

Nearly half of the followers that outperformed did so primarily through superior efficacy, often demonstrated in head-to-head trials against the earlier entrants. For example, the anaplastic lymphoma kinase (ALK) inhibitor Alecensa reduced the risk of progression or death by nearly 50% compared to Xalkori in ALK-positive non-small cell lung cancer, while the integrase strand transfer inhibitor Tivicay showed a higher barrier to resistance than Isentress in the treatment of HIV.

About a quarter of outperformers differentiated on safety rather than efficacy. In these cases, the improvements were often significant — such as eliminating a black box warning present on the first entrant (e.g., Farxiga, which lacked the amputation risk warning seen with earlier sodium-glucose transport protein 2 inhibitors) or markedly reducing serious adverse events such as hematologic or cardiovascular complications.

While follower outperformance based solely on convenience is less common, it is possible — particularly in chronic, non-life-threatening conditions such as asthma, migraine or psoriasis. In these cases, enhancements such as longer dosing intervals or transitioning from injectable to oral formulations played a role, often alongside other success factors such as rapid indication expansion.

Large biopharma companies have an advantage

Large biopharma companies (with market capitalizations over $40 billion) hold a distinct advantage when launching a later entrant. Their robust commercial infrastructure, deep industry experience, extensive customer networks and strong life cycle management capabilities enable them to drive significant market impact — even without a first-mover advantage. These companies can invest in differentiated clinical trials and large-scale marketing efforts, helping them stand out in competitive spaces. As a result, they account for a disproportionate share of products that ultimately outperform first-to-market competitors (see Figure 3).

In contrast, smaller companies face significantly greater challenges. Of the more than 40 late entrants they commercialized, none outperformed the first entrant. 

Figure 3

Distribution of late-entrant launches by commercializing company size in year three (market cap) (2012-2023 FDA approvals)

Image
Distribution of late-entrant launches by commercializing company size in year three (market cap) (2012-2023 FDA approvals)

Figure 3

Distribution of late-entrant launches by commercializing company size in year three (market cap) (2012-2023 FDA approvals)

Image
Distribution of late-entrant launches by commercializing company size in year three (market cap) (2012-2023 FDA approvals)

When is it too late to launch a late entrant?

The answer is nuanced, but timing, differentiation and company scale are the critical drivers of success.

For products with strong differentiation — particularly in efficacy and/or safety — it may never be too late to enter. A compelling clinical value proposition can persuade physicians to switch, even for latecomers. However, the bar is high: Differentiation must translate into meaningful patient benefits and outcomes, not just statistically significant improvements on clinical end points.

For products that are more than two years behind the first-in-class product and lack clear differentiation, executives should carefully reassess further investment. If return-on-investment (ROI) projections are weak, it may be prudent to redirect development efforts toward targeted patient subgroups or alternative indications where there is unmet need or competitive intensity is lower. This consideration is especially important for smaller companies, which rarely succeed with undifferentiated late entrants.

In more challenging scenarios, partnering or out-licensing may offer a strategic path to unlock value while reallocating resources toward assets with higher potential in the portfolio.

To increase the likelihood of success, executives managing late entrants should consider the following six strategic actions:

  1. Assess differentiation and ROI early: Rigorously evaluate the product’s potential for clinical differentiation and expected ROI — especially if launch is more than two years behind a first-in-class competitor.
  2. Scale investment strategically: Right-size investment levels to reflect the increased difficulty of gaining market share.
  3. Prioritize efficacy differentiation: Focus development efforts on demonstrating superior efficacy, which remains the most compelling driver of prescriber adoption.
  4. Highlight safety advantages: Evaluate whether the product offers a more favorable safety profile — particularly in therapeutic areas where safety concerns heavily influence prescribing behavior.
  5. Don’t overweight convenience: Avoid relying solely on convenience-based features (e.g., dosing, administration route) to drive differentiation; while occasionally successful, this strategy rarely leads to market outperformance on its own.
  6. Consider strategic partnerships: Smaller biotech firms should explore partnerships or licensing opportunities with larger, more experienced companies to improve launch execution and long-term success potential.  

A well-timed and clearly differentiated product can still perform strongly as a late entrant. But without meaningful advantages and adequate resources, the opportunity for success may quickly close.  

Methodology

Definition of therapeutic class: A mechanism of action within a disease or group of diseases.

Definition of outperformance: Generating more U.S. sales in year five post-Food and Drug Administration approval, relative to the first entrant, than would be expected by industry-standard order-of-entry share expectations. In all analyses, products were only considered outperformers if they also generated at least $300 million in year-five U.S. sales.

Definition of differentiation: A clinically meaningful improvement from the first entrant in the class based on (1) head-to-head trials directly comparing efficacy or safety, (2) indirect comparisons of clinical data, or (3) broader attributes not requiring published comparisons, such as label enhancements (e.g., removal of black box warnings) or convenience benefits. 

The authors would like to thank Katherine Taylor and Katharina Novikov for their important contributions.  

For more information, please contact us.

L.E.K. Consulting is a registered trademark of L.E.K. Consulting LLC. All other products and brands mentioned in this document are properties of their respective owners. © 2025 L.E.K. Consulting LLC 

Endnotes
1See methodology box for definition of outperformance. Some of the products were not assessed for outperformance due to missing first-entrant sales data from Evaluate Pharma.
2With 30 unique products across these two groups. 

Questions about our latest thinking?

English
Executive Insights

AI Product Packaging Strategies: Making Strategic Choices in the AI Era

April 24, 2025

Key takeaways

Companies adopt one of three integration approaches around artificial intelligence (AI): premium add-ons (30%-110% price premium), embedded features or hybrid models that combine both strategies to balance adoption with revenue growth  

Industry context shapes packaging decisions, with productivity software broadly embedding AI while regulated sectors like healthcare use hybrid models addressing compliance and workflow requirements  

The chosen packaging strategy directly impacts market positioning — embedded AI drives widespread adoption, while add-ons enable precise demand-testing without disrupting core offerings  

Variable inference costs are pushing SaaS companies toward flexible pricing that balances accessible adoption with sustainable margins as AI usage scales  

While some SaaS businesses embed AI directly into their platforms, others sell it as a premium add-on or adopt a hybrid model that blends embedded AI with usage-based monetization. With no standard pricing approach, vendors are experimenting — introducing per-interaction pricing, bundling AI into subscriptions and offering flexible, usage-based plans to meet evolving enterprise demand.

This is the second installment of our series on AI-driven pricing models, following our examination of how AI is reshaping the SaaS industry in Part 1. Now, we turn to how companies structure and package AI-powered features within their products. Choosing the right strategy is key to driving adoption while optimizing revenue.

Three core approaches to AI integration

The three approaches described below influence how businesses monetize AI, differentiate their offerings and drive long-term customer value.

The add-on approach

This model offers AI as a premium add-on, with companies charging 30%-110% above base pricing, according to research by Tom Tunguz. This model enables businesses to put commercial focus on the AI feature, accurately test demand and drive upsells without affecting the core packages. However, it also limits the immediate user base to which the AI feature is pushed, and fundamentally positions AI outside the core packages in a manner that may not be appropriate as these features become more standard across platforms.

Notion and Slack follow this model, offering AI-powered tools — such as AI-assisted writing and summarization (Notion AI) and smart recaps and automated message threading (Slack AI) — only as separate add-ons for an additional cost per user, per month.

The embedded approach

In this model, AI capabilities are integrated directly into core packages, providing immediate access to all users who have access to the relevant tier(s). The tier system can take one of two forms:

  • Base tier embedding: AI features are included in basic plans to drive widespread adoption.
  • Premium tier embedding: AI capabilities are reserved for higher-priced tiers, encouraging upsells.

HubSpot’s integration of AI across its CRM, marketing and sales tools led to a 21% year-over-year sales increase, demonstrating how embedding AI can drive both adoption and revenue growth. Making AI a core feature, even at the base tier, enhances engagement and retention but requires careful margin management.

The hybrid approach

This strategy blends embedded AI with premium AI upgrades, offering multiple monetization paths:

  • Embedding basic AI in base tiers while offering advanced features as add-ons
  • Distributing stratified AI capabilities across product tiers or as add-ons to align with different customer needs

Zendesk recently expanded access to its AI agent feature across all tiers while keeping advanced chatbot automation and workflow optimizations as premium add-ons. A recent analysis by Dave Kellogg suggests this approach is gaining traction as companies balance accessibility with premium positioning.

As AI pricing models evolve, vendors are making real-time adjustments to meet enterprise demand. Google bundled Gemini AI into its standard $14 Business plan — previously this required an additional $20 add-on — signaling a shift toward embedded AI at lower price points to drive adoption. These shifts show an evolving industry where AI pricing remains in flux (and may also be a recognition of declining costs associated with AI usage). 

AI packaging strategies across industries

AI pricing models vary based on how the technology integrates into specific industries or workflows (see Table A). Some categories, like productivity software and cybersecurity, favor embedded AI, making AI-powered features standard within core products. Others — such as healthcare and sales automation — are more likely to rely on hybrid or add-on models, balancing regulatory constraints, specialized functionality and value-based pricing. 

Table A

Example AI pricing models by category 

Image
Example AI pricing models by category

Table A

Example AI pricing models by category 

Image
Example AI pricing models by category

Many industries have successfully balanced embedded AI and premium upgrades, but healthcare AI presents unique challenges.

Healthcare AI: A deeper look

Healthcare AI pricing is shaped by regulatory, operational and reimbursement constraints, requiring a balance of compliance, accessibility and ROI. Unlike market-driven adoption in ecommerce or DevOps, healthcare AI must integrate with clinical workflows, align with reimbursement models and demonstrate patient impact.

Table B (below) outlines how some healthcare AI prices are packaged, from outcome-based pricing that ties costs to clinical results to hybrid models that blend embedded AI with premium analytics upgrades.

Table B

Healthcare AI pricing models 

Image
Healthcare AI pricing models

Table B

Healthcare AI pricing models 

Image
Healthcare AI pricing models

By structuring pricing around regulatory and operational realities, healthcare AI companies can drive adoption while ensuring compliance and financial sustainability.

The rise of AI-embedded platforms

AI is no longer just an add-on — leading SaaS companies now embed it across their platforms to boost engagement, automation and scalable monetization. This industry shift integrates AI into core workflows, making it essential to the user experience.

Rather than charging separately, companies increasingly package AI within existing ecosystems, reserving premium features for higher-tier plans or usage-based pricing. This approach maximizes adoption while managing AI-driven costs.

At the enterprise level, Microsoft and Salesforce embed AI throughout their entire platforms while refining pricing in bespoke ways to drive adoption and profitability.

Microsoft Copilot

Integrated across Word, Excel, Teams and Outlook, Copilot automates document drafting, data analysis and email responses within familiar workflows. The free Copilot Chat provides GPT-4o-powered assistance, while enterprises can access AI agents via metered pricing. For deeper integration into Microsoft 365, Copilot Pro is available as an add-on for $30 per user, per month (see Figure 1).

Figure 1

Microsoft 365 Copilot pricing page, March 2025 

Image
Microsoft 365 Copilot pricing page, March 2025

Figure 1

Microsoft 365 Copilot pricing page, March 2025 

Image
Microsoft 365 Copilot pricing page, March 2025

Source: Microsoft

Salesforce Einstein

AI is embedded throughout the Salesforce ecosystem, providing predictive insights, automated recommendations and workflow automation. While some Einstein features are included in standard editions, Einstein GPT and advanced AI tools require separate licenses, starting at $50 per user, per month (see Figure 2).

Figure 2

Salesforce Sales Cloud pricing page, March 2025 

Image
Salesforce Sales Cloud pricing page, March 2025

Figure 2

Salesforce Sales Cloud pricing page, March 2025 

Image
Salesforce Sales Cloud pricing page, March 2025

Source: Salesforce 

This platformwide, embedded AI approach represents a fundamental shift in SaaS pricing — ensuring AI is accessible while monetizing its most advanced capabilities. As AI adoption accelerates, companies will continue refining platformwide integration strategies to balance value, cost and competitive differentiation.

AI pricing remains fluid as vendors balance accessibility with profitability. A key challenge is managing inference costs, or variable AI-related costs — an ongoing expense that scales with usage. To maintain margins, companies are shifting toward hybrid and consumption-based pricing models.

AI usage costs in your packaging strategy

AI introduces variable costs not typically associated with traditional SaaS features, primarily due to ongoing expenses from real-time model operations. While AI development involves substantial up-front investments, the primary recurring financial concern stems from unpredictable customer usage, making cost management crucial.

While computer-driven pricing models (similar to cloud-based billing) align costs directly with resource usage, ensuring sustainable margins as adoption scales, they often increase customer budgeting complexity and anxiety.

Ultimately, vendors must balance accessibility with financial sustainability, structuring AI pricing to reflect actual usage costs. Striking this balance — keeping AI adoption straightforward for customers while realistically managing the financial demands of large-scale AI deployments — is essential.

Charting the path forward

Generative AI is transforming SaaS packaging and pricing, demanding a balance among value creation, adoption and profitability. As companies weigh adoption friction, cost recovery and monetization potential, success depends on managing variable AI costs, setting clear usage limits and responding to market shifts. The winning approach aligns with your market position and customer needs — those balancing financial sustainability with customer expectations will gain competitive advantage.

In our next article in this series, “Pricing Models for AI Features,” we’ll explore pricing structures that complement these packaging strategies — from consumption-based to value-based models — helping you both package and price your AI offerings for maximum success.

L.E.K. Consulting helps SaaS businesses navigate AI pricing and packaging strategies. To explore the right approach for your business, please contact us.

L.E.K. Consulting is a registered trademark of L.E.K. Consulting LLC. All other products and brands mentioned in this document are properties of their respective owners. © 2025 L.E.K. Consulting LLC

Questions about our latest thinking?

English
Subscribe to