Image
CIT LEK logo

Omnichannel Engagement in Pharma — Key Success Factors and Case Examples

Authored in partnership with Loop Horizon and CI&T
May 24, 2021

Image
omnichannel definition
Image
omnichannel definition

A number of related shortcomings have stood in the way of a true omnichannel experience in pharma.

  • Lack of audience-specific content and channels: HCPs and patients want answers to their specific questions, relayed in a concise and engaging way, and via channels convenient to them. Rather than addressing what HCPs and patients want to hear, pharma companies all too often focus on the messages they want to convey and the channels they themselves are comfortable using.
     
  • Poor orchestration of channels and content, limited learnings: The success of omnichannel engagement requires the use of the right audience-specific content and channels, at the right time. Beyond a good understanding of customer preferences and behaviours, this needs orchestration and, critically, a feedback loop to assess how well engagement is working and how it needs to be adapted.
     
  • Different channels, but the same content: Rather than creating custom-made experiences based on a specific content-channel mix, existing content is often reused and repackaged in a way that can be difficult to navigate and may not be appropriate for the given channel.

The barriers to implementing a true omnichannel engagement are substantial. First, it is a tall order: Creating an omnichannel experience requires deep customer knowledge, mastery of relevant channels, powerful content for each channel, highly coordinated action across channels and the agility to adapt in response to customers’ feedback. It’s an ongoing learning process built on data, monitoring discipline and agility. This might require significant organisational changes both to a company’s operating model and its capabilities and supporting infrastructure — changes that are time-consuming, costly and potentially risky, and need to be balanced against an understandable reluctance to move away from tried and tested models.

Second, in light of the complexity of implementation, pharma companies require a vision — a reason to believe in the benefits of large-scale change — and best practice examples demonstrating the benefits of omnichannel and providing templates for how to realise them. Yet, benefits are all too often not sufficiently tangible, and success stories are rare. Pharma needs to look to other industries for inspiration.

However, momentum towards omnichannel engagement is increasing, building on powerful market trends and changing customer needs. Pharma companies are being forced to rethink the way they interact with customers, driven by the proliferation of technology and mobile connectivity, increasing experience with digital engagement, growing price pressure and the resulting need to increase the cost-effectiveness of engagement, and restricted sales rep access. This is paired with growing customer needs for on-demand and personalised content, agile support, and an increasing affinity with non-personal and digital forms of engagement (see Figure 2).

Image
omni channel momentum
Image
omni channel momentum

Early signs of success — selected case studies

While efforts to define and implement omnichannel models are ongoing, examples of a successful full-scale omnichannel overhaul in pharma are rare. However, there are a number of early success stories of pharma companies establishing omnichannel approaches for specific segments or built on a small number of channels.

Example 1: Large pharma refocusing its engagement with physicians and patients

In order to increase its market share for oral contraceptives, a large pharmaceutical company planned to introduce an app to remind women to take their pill on a regular basis. However, a detailed analysis of usage data unveiled that, at the current rate, achieving the envisioned market share growth would take eight years instead of the anticipated 18 months; in addition, the company would have to get 10,000 new prescriptions a month to reach its growth target, which was deemed unachievable with an app alone.

Based on market research and advanced analytics, target audiences with the highest potential for growth were identified, and the company’s sales force was redeployed to higher-potential locations based on refined brick data. Resources were also redirected to focus more on patients, with direct outreach to increase brand awareness and engagement through patient support programmes, as well as content such as blog posts on pregnancy prevention.

The integrated approach leveraging multiple channels helped build greater connections between the organisation’s two target audiences, doctors and patients, and overall sales force effectiveness was increased. In addition, the extensive market analysis created excitement and support amongst senior leadership within the organisation, including shareholders and owners. Overall, the product saw a growth of 23% in volume from new customers as a result of the optimised channel mix.

Example 2: Large pharma building B2B engagement platform for pharmacists across Europe

In the diverse European pharmaceutical market landscape, characterised by country-specific rules and regulations around pharmacy engagement, drug manufacturers are often not able to engage with smaller pharmacies directly to build relationships and offer promotions or discounts.

Leveraging existing technology platforms such as Salesforce and SAP, a multinational pharmaceutical company created a business-to-business (B2B) engagement platform that would allow it to design and deliver locally compliant content to pharmacists across European markets end to end without the need to outsource to third parties. The platform was built on scalable and localised architecture for multiple sites and languages, respecting the legal and language requirements of each country, and offering localised content and personalised communication for targets.

Through a single unified platform for content development, content management, pricing and sales, the multinational pharma company was able to access information and align strategic and business objectives across Europe. Initially released in France, Belgium and Luxembourg, the sales enablement and educational platform for pharmacists reached US $1 million in revenues and registered more than 900 pharmacies in the first three weeks of operation.

Example 3: Biopharma company increasing global ex-US reach and engagement without adding to field force

A biopharma company planned to increase its reach and engagement with key HCP customers for a major dermatology product across its non-US markets in a highly efficient manner, leveraging existing customer intelligence and without increasing field force resources.

Based on its existing intelligence, four key HCP segments were identified and engaged with through an orchestrated campaign covering email, paid media, portals and partner channels. An automated loop was also created to re-engage or progress key messaging based on HCP behaviours.

Through this orchestrated campaign and loop, the company was able to increase its target audience reach by 29% and engagement by 53% over the course of 16 weeks.

Example 4: Pharmaceutical company improving mature product’s positioning in Europe

Across the diverse and fragmented European market, a pharmaceutical company sought to increase the adoption of its mature respiratory product by improving the delivery and impact of its key messages.

Based on market research and analytics, a system of pre- and post-call rep-triggered events was created, allowing reps to choose further engagements and content appropriate to the particular HCP type, the desired key messages and the outcome of the call.

This systematic approach, combined with leveraging of the company’s Veeva software to automatically suggest content for follow-up email campaigns, resulted in increased email open rates among targeted HCPs by 46% and overall engagement by 73% over 10 weeks.

Key success factors

From early examples, we can derive some initial success factors for omnichannel.

  • Developing relevant content: Content needs to be curated that fits both the channel and the segment. In order to stand out from the competition, it will be critical to ensure content is of high value — highly relevant, differentiated, well communicated and ideally customised — in order to drive engagement.
     
  • Finding the right mix of channels appropriate for your audience at the time of engagement: This requires a deep understanding of HCP behaviours, meaningful HCP segmentation and identification of needs within each segment, and the ability to adapt as HCP behaviours evolve.
     
  • Orchestrating the channels: Clear roles and interfaces between the channels are needed to ensure a seamless customer experience by mapping customer journeys across channels with appropriate handoffs.
     
  • Establishing a ‘closed feedback loop’ to ensure continuous adaptation of engagement (content and channel mix): Sophisticated data collection and analysis capabilities, agility, and time are needed to optimise omnichannel engagement over time and incorporate potentially evolving HCP behaviours.

The creation of a successful omnichannel model can trigger significant organisational and behavioural changes in pharma companies. A number of factors should be kept in mind during implementation.

  • Mandate from the top: Define a clear vision, and ensure that this vision and the resulting need for change are communicated by leadership in order to secure buy-in within the organisation.
     
  • Deliver centrally: Establishing a centre of excellence is beneficial not only in leading the implementation but also in driving capability into business units.
     
  • Review and adapt the operating model: Omnichannel engagement cannot be implemented without a hard look at the underlying operating model, in particular the processes and responsibilities of sales and marketing and medical functions.
     
  • Leverage existing capabilities: Building on existing capabilities in an iterative fashion can drive quick wins.
     
  • Manage change robustly: The changes triggered by omnichannel require many roles across the organisation to shift focus and call for robust change management.

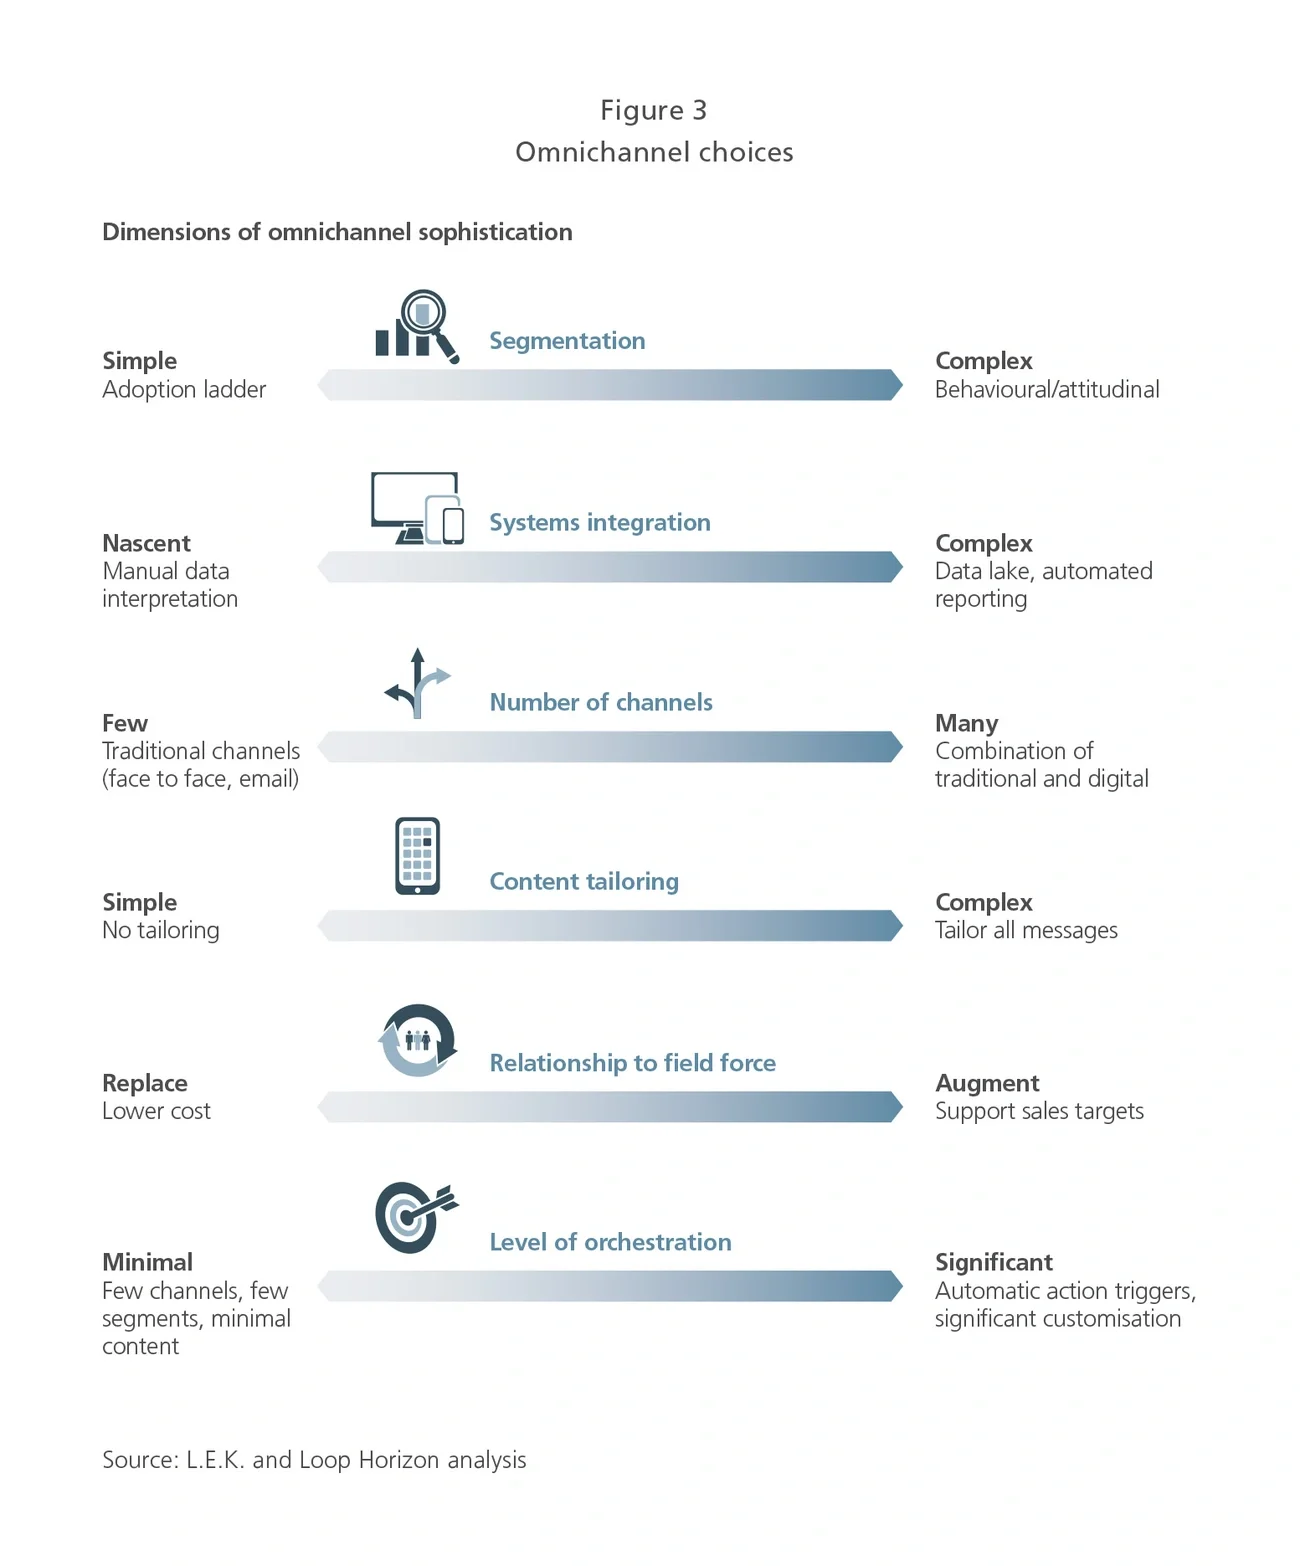
Before developing an omnichannel model, pharma companies need to consider a number of trade-offs around market benefits, existing capabilities and cost. Omnichannel models are inherently complex, and complexity grows exponentially with each channel, customer segment and content customisation, creating the risk of overwhelming marketing teams. It is therefore critical that pharma companies carefully assess the degree of sophistication needed along a number of dimensions to develop a fit-for-purpose and actionable omnichannel approach (see Figure 3) . 

Image
omni channel choices
Image
omni channel choices

Along each of these dimensions, trade-offs need to be considered. As an example, developing complex attitudinal segmentation is time-consuming and costly but allows more granular and potentially more effective messaging. When designing content, pharma companies need to strike a balance between providing meaningful content tailored to specific channels and customer segments, and the complexity of customisation, specifically as more channels and segments are added. Similarly, significant orchestration maximises omnichannel impact but is costly and time- consuming to implement, so returns on investment (ROI) need to be evaluated carefully.

How to bring omnichannel to life

Implementing a successful omnichannel strategy is by no means easy. L.E.K. Consulting , therefore, suggests approaching the omnichannel transition in a series of steps: 

  1. Define an omnichannel vision that clearly sets the goals and helps determine what level of omnichannel sophistication is required
     
  2. Determine the required future state of omnichannel maturity based on the defined vision and goals
     
  3. Assess the company’s current omnichannel maturity
     
  4. Devise an implementation plan to help fill gaps identified and achieve the desired future state
     
  5. Establish a system for ongoing testing and learning from omnichannel initiatives

Based on project experience, we have developed a perspective on how each of the five steps can be successfully managed. Our approach defines six organisational and brand-specific capabilities which form the pillars of omnichannel engagement and combine to deliver an orchestrated engagement model: organisational vision and preparation, operating model, connected tech and data, customer intelligence, channels, and tailored content. 

Omnichannel has the power to transform the way pharma companies engage with their customers and other key stakeholders, making interactions more meaningful, valuable and impactful for both sides. In order to not fall behind and to benefit from this dynamic, pharma companies need to start on this journey now to transform their engagement approach and, ultimately, themselves. 

Authored in partnership with Loop Horizon and CI&T

LuizCieslakLuiz Cieslak, Vice President of Digital Solutions, CI&T

CarolinaWosiack.jpgCarolina Wosiack, Managing Director EMEA, CI&T

RobertMcLaughlinRobert McLaughlin, Co-Founder, Loop Horizon

Loop Horizon is a consulting & technology company with expertise across Consumer, B2B and Health, and a strategic partner of L.E.K. Consulting. Loop Horizon guides companies in optimising their customer experiences through better combinations of data & intelligence and marketing technology, and supports process change to drive P&L benefit.

CI&T is a leader in driving digital transformation for global brands. For over 20 years, CI&T has been a trusted partner in helping Fortune 1000 companies drive growth and continuous innovation across business, people, and technology.

English

The US Could Become a Leading Market in High-Speed Rail

April 7, 2021

To date, the US does not have any truly high-speed rail services. The fastest train service in the US today is Acela, which connects Washington to Boston at an average speed of 70 miles per hour. True high speed travels at up to 200 miles per hour and averages 125 miles per hour, for example, between Tokyo and Osaka.

Train travel has historically fallen out of favour in the US, losing out to the convenience and economics of car and plane travel. However, given the environmental credentials, superior comfort and predictability as well as the increasing importance of being online during the journey, rail has huge potential.

Given the geography of the US and the number of large, growing and wealthy cities situated the optimal distance for successful high-speed rail lines, the US could be a significant market for high-speed rail. Analysis of US city-pairs suggests there are very many routes that could succeed with federal grant funding and a commercial investor approach to development.

If the Biden administration’s planned $2 trillion upgrade to the nation’s infrastructure were to create a high-speed rail network that achieved the same market share as is already seen in Europe, the US domestic travel market could look dramatically different from today:

  • Approximately 400m journeys per year could be taken by high-speed rail
     
  • If 10%-30% of these journeys came from people choosing not to fly, then 500-1,500 domestic flights per day would no longer be needed
     
  • High-speed rail lines could connect US cities such as Dallas, Houston, Las Vegas, Los Angeles, Phoenix, Miami, Orlando, Chicago and Columbus 

Far from being a threat to the airline sector, experience around the world suggests that high-speed rail can complement the existing air network by providing an alternative on low-yielding routes, releasing slot constraints at airports, and allowing newer and more profitable routes to be pursued. 

The short-haul market (less than a two-hour flight) has not been a growth area in the US and is not, in general, an attractive proposition for travellers who have to contend with intrusive security for a relatively short flight. In Taiwan, high-speed rail has enabled air operators to reduce domestic services and increase frequency to mainland China. In Europe, Paris-Amsterdam and Madrid-Barcelona routes are examples of high-speed rail operators collaborating with airlines to provide feeder services that allow airlines to exit low-yield routes while still feeding more profitable routes with connecting passengers.

The Biden administration’s significant funding of high-speed rail could make a substantial impact alongside private sector plans that are already well developed.

The key to making such systems work is to include a commercial approach to running the railways. This means including factors such as prioritising revenue rather than patronage, high standards of customer service, premium classes of travel, and airline-style yield management to fairly ration supply at peak times and attract lower fare-paying travellers off-peak. All of these factors increase the viability of high-speed rail lines and help maximise the ‘bang for the buck’ on federal taxpayer funds.

If the US federal authorities work flexibly and rapidly with private investors, this new funding could genuinely spark a second railroad revolution.

***
Editor’s note

L.E.K. Consulting is a world leader in business planning and forecasting for high-speed rail. Our experts have worked around the world with investors and governments, developing investment-grade ridership forecasts that also include commercial expertise in how to run transport businesses profitably. 

English
Executive Insights

Trends in Pharma Asset Licensing and Deal Terms: A Survey of Key Decision-Makers

March 19, 2021

Image
survey respondents
Image
survey respondents

Key factors driving asset value for licensing

As expected, therapeutic areas with high unmet need, market exclusivity and differentiated efficacy over the standard of care (SOC) are among the most important attributes for BD teams considering asset in-licensing. As a sign of the synergy licensing brings, companies that are out-licensing assets rate commercialization capabilities and disease area expertise as key determinants of suitable acquirers. Encouragingly, these complementary expertise areas converge to increase the probability of bringing treatments to patients in need. Factors of greatest importance to buyers during asset evaluation and deal negotiation ― differentiation, high unmet need and exclusive rights — outweigh other considerations (see Figure 2).

Image
pharma deal assessment
Image
pharma deal assessment

Consensus on deal structure expectations

Despite some minor differences, buyers and sellers largely agree on how to structure deal payments. When deals fall through, misaligned assessment of asset value, structure of deal terms and distribution of future asset value between parties are the most common causes.

The total deal value and proportion attributed to upfront, milestone and royalty payments form the crux of licensing deal negotiations. Parties agree that milestone payments represent the majority of deal value, and also agree on the value assigned to royalty payments. Not surprisingly, sellers expect higher upfront payments than do buyers, who in turn apportion more deal value to longer-term R&D and commercial milestones. However, overall, the buy and sell sides are surprisingly well aligned on the structure of deal terms, setting up reliable benchmark expectations for initial deal term offerings.

Buyers and sellers closely align on division of total deal value into component terms. Despite differing expectations for upfront and milestone payments, first-estimate terms are broadly established (see Figure 3).

Image
expected distribution
Image
expected distribution

Out-licensers may be underselling late-stage assets

Possibly more important than deal structure is the value split between negotiating parties — i.e., of the total value realized by an asset, what percentage sellers realize through deal term payments and buyers retain through revenue.

Development stage at licensing strongly influences the percentage of value sellers realize. As a molecule becomes de-risked and closer to market, developers can expect a higher proportion of asset value on licensing. Parties strongly align on this for early-stage assets. Strikingly, for late-stage assets — Phase 3 and beyond — out-licensing companies may be underselling their assets, with buyers willing to attribute higher value to development they have completed. In other words, sellers may not be extracting as much value as they could for taking assets further in development.

Buyers and sellers broadly agree on asset value distribution between parties for early-stage assets. For late-stage assets, sellers may assign more value to buyers than needed (see Figure 4).

Image
developmental stage
Image
developmental stage

This data also points to buyers’ desire to acquire de-risked assets. It is striking that the development phase is a bigger factor than asset revenue potential in determining asset value split. Buyers want to mitigate risk of development failure, and they consider alignment with company corporate strategy and portfolio as important as revenue potential.

Clinical POC drives novel MoA value creation

Degree of novelty can be a double-edged sword during asset assessment. Novel modalities and MoAs are sought after, particularly in oncology and rare disease, where personalized treatments for targeted patient populations have become the norm. Buyers expect an increasing number of deals that license novel modalities and MoAs over the next five years. However, buyers attribute less value to novel modalities than do sellers; sellers expect earlier and higher premiums relative to assets with known MoAs. Both parties agree that demonstrating clinical POC is a key inflection point in achieving greater asset value. Phase 2 data is viewed as the key inflection point for clinical POC for most assets; however, oncology studies may have POC readouts earlier in development that allow for an earlier realization of increased deal value.

For assets with novel MoAs, POC is a key value creation inflection point. Sellers expect earlier and higher premiums than do buyers of novel assets, particularly pre-POC assets (see Figure 5).

Image
asset value premium
Image
asset value premium

Increased deal count and value expected in future

The general view is that the number of deals will increase in coming years. Traditional licensing deals will continue to dominate, though this increase is also expected for co-development, joint venture and early commercialization option deals. Buyers predict the biggest increase in traditional licensing deals, while sellers expect joint ventures to increase, communicating their desire to become partners in development.

BD professionals expect net increases in the number of deals across archetypes in the next five years. Buyers expect traditional licensing to dominate, while sellers expect more joint ventures (see Figure 6).

Image
deal types
Image
deal types

There is also a shared view that the total value of licensing deals may increase. Buyers expect a higher proportion of asset value in R&D support and commercial milestones, while sellers expect the largest increase in milestones with nearer-term payouts. Buyers and sellers agree that total deal value may increase over the next five years but differ on what will drive the lift (see Figure 7).

Image
expected changes
Image
expected changes

Conclusion

Some of the global, therapeutic-area-agnostic findings emerging from L.E.K.’s survey of 81 BD professionals suggest healthy interest in continued deal-making and encouraging alignment between buyers and sellers on deal term expectations. Depending on the specific asset attributes and stage of development, the data establishes reliable expectations for initial deal term sheets.

Editor’s note: This article was originally published in lifescienceleader.com.

Trends in Pharma Asset Licensing and Deal Terms: A Survey of Key Decision-Makers was written by Lain Anderson, Managing Director; TJ Bilodeau, Managing Director; and Rosie Jiang, Global Healthcare Specialist. Lain, TJ, and Rosie are based in Boston. Thank you to Brendan Kelly for his valuable contributions to this article.

For more information, contact lifesciences@lek.com.

English
Executive Insights

Asia-Pacific 2021 Hospital Priorities: Settling Into the New Normal

March 11, 2021

Key takeaways

  • The COVID-19 pandemic has had a profound impact on hospitals, bringing new challenges, opportunities and resilience for medtech and pharma companies.
     
  • With the shift of hospital priorities towards emergency preparedness and financial recovery to manage the impact of COVID-19, medtech and pharma companies should expect greater scrutiny of economics and sensitivity on direct and immediate budgetary impacts compared to pre-COVID-19 times.

  • However, new opportunities arise for those who are able to quickly pivot their strategy and support hospitals with the acceleration in adoption of digital health solutions and digital communication tools.

  • The winners in the new era will be those that adapt to the needs of their customers and create win-wins during this unprecedented time.


L.E.K. Consulting conducted the 2021 APAC Hospital Priority Survey with 411 hospital executives across both public and private hospitals in countries1 across the Asia-Pacific (APAC) region. The fieldwork was executed in collaboration with GRG Health.2 This article aims to provide an overview and understanding of the rapidly changing landscape in which hospitals are operating and identifies key trends within the region. Insights are provided into how hospitals across the region have adapted to the impact of the COVID-19 pandemic, and how this has shaped their priorities for the future.

Given these insights, the following trends have emerged from the survey:

  • Shifting priorities to manage the impact of the pandemic

  • Accelerating adoption of digital health solutions to expand capacity and improve clinical decision-making

  • Leveraging digital channels to maintain engagement with physicians

This article also features the cost containment efforts for pharma products through the use of VBP (volume-based procurement) and the NRDL (National Reimbursement Drug List) in China, and through the introduction of formulary guidelines in Japan.

The COVID-19 pandemic has had a profound impact on hospitals; with hospitals having been caught unaware, they have naturally placed a higher priority on emergency preparedness going forward. However, there is also a clear need to shore up finances and maintain the hospital as a safe place for human capital. Other items that were on the typical hospital executive’s agenda, such as offering clinicians access to new medical technology and standardization of clinical care protocols, have fallen down the list of priorities versus the immediateness of readiness and financial recovery. Medtech and pharma companies should expect greater scrutiny of economics and sensitivity on direct and immediate budgetary impacts compared to pre-COVID-19 times.

The top three strategic priorities in the region are emergency preparedness, recovering from the financial impact of COVID-19 and improving healthcare worker safety (Figure 1). Among these priorities, emergency preparedness remains a crucial, ongoing priority. Despite being able to control the spread of the pandemic initially, many countries have still been hit with subsequent waves that are proving harder to control.

Hospital spending over the next three years is expected to decrease. Due to ongoing uncertainty, the share of hospitals planning to increase spending fell from 30%-40% to 15%-25%. Although most hospitals in the region are showing more conservative planned spending compared to last year, Australia and China indicated planned spending sentiment that was similar to that of the previous year. On average, about 40% of hospitals in both countries intend to increase spending across all categories. Pandemic response aside, governments in the region have been trying to rein in healthcare costs. A specific example, which is explored in the feature box on page 5, is drug cost management policies in China and Japan.

Figure 1

Image
hospital-priorities

Figure 1

Image
hospital-priorities

Further, the pandemic-driven downturn in elective surgeries and patient consultations has affected hospital revenues. Much uncertainty regarding future patient volumes also remains. While the easing of restrictions and the implementation of new standard operating procedures have allowed some elective surgeries and outpatient consultations to resume, hospitals are unable to predict possible future surges that may cause a change of operational posture and priorities. As a consequence, this year also saw a reduction in planned capital expenditure for medical devices and equipment, especially for diagnostic imaging equipment, and to a lesser extent clinical support appliances. Compared with last year’s survey, fewer hospitals expect an increase in capital expenditure over the next three years. However, this is not true across all medical device categories; nearly 7 out of 10 of those surveyed are expecting to spend more on medical consumables, up from 5 out of 10 in the previous year. Similarly, more hospitals are planning to increase spending on implantable medical devices this year compared to the previous year.

Hospitals are also planning to cope with the backlog of deferred procedures. In Australia, for example, the return of patients to hospitals has caused increased wait times to between 240 and 365 days for nonurgent elective surgeries.3,4 Hospitals are looking to their business partners to help with these types of challenges; a third of respondents ranked improving efficiency as one of the top three areas for which they are looking to medtech companies for help. This is in line with overall priorities, as 52% of hospitals indicated improving labor efficiency to be a top 5 priority. Hospitals have also indicated the increased use of digital solutions, which is covered in the next section.

The pandemic, with its restrictions on patient mobility and accompanying risk aversion to hospitals, has brought about an increased acceptance of digital health for all stakeholders. This has led to accelerated adoption of solutions such as teleconsultation, artificial intelligence (AI)-aided image analysis and remote patient monitoring. Although hospitals see the value of digital health solutions, concerns such as changing the standard of care and ensuring interoperability need to be addressed for wider acceptance and adoption.

COVID-19 has made hospitals more willing to test out new solutions. Patients are more receptive to digital alternatives, and governments see the benefit of greater adoption. Increasingly, regulations are being eased and reimbursements are being formalized for digital health solutions.5,6

Figure 2

Image
hospital-digital-health

Figure 2

Image
hospital-digital-health

Overall, hospitals are increasingly turning to digital health solutions to strengthen their service (Figure 2), with around 1 in 4 hospitals in Australia, China and Singapore already using digital health solutions in patient diagnosis, treatment, remote patient monitoring and consultations. Even in Japan, where the percentage of hospitals currently using digital health solutions remains low, around half of hospitals are trialing or interested.

Some recent examples of digital solutions being deployed to cope with a surge in patients seeking diagnosis and treatment for COVID-19 are AI image analysis by Chinese company Infervision to identify potential COVID-19 patients, remote patient monitoring by Biofourmis for real-time vital signs and symptoms tracking for patients waiting for swab test results, and robot assistants for food and drug delivery in Indonesia and India in order to limit healthcare workers’ exposure to infectious patients.

Hospitals see the most value from digital health in the reduction of medical errors and increased patient satisfaction (Figure 3). To realize such value, 65% of hospitals are increasing spending on hospital digitalization. For example, Philips IntelliSpace Critical Care and Anesthesia was introduced in Indonesia last year, in order to minimize medical errors. In South Korea, a smart hospital uses its digital infrastructure to track its personnel in real time for more efficient staff deployment.

Figure 3

Image
value-digital-health

Figure 3

Image
value-digital-health

Despite the increased adoption of digital health solutions, concerns remain, and three key areas stand out: adjusting the standard of care for digital care, the interoperability (or lack thereof) of different solutions and increased concerns around patient privacy (Figure 4).

Figure 4

Image
concerns-digital-health-adoption

Figure 4

Image
concerns-digital-health-adoption

Of greatest concern for hospitals in the region is the adjustment of the current standard of care in order to integrate digital health solutions. In the traditional care setting, patients would physically go to hospitals to receive care. However, with care shifting away from hospitals and with increasing availability of newer solutions such as electrocardiogram-enabled smart watches, remote monitoring solutions and at-home testing kits, care can now be given while patients and physicians are physically apart. Given this shift, hospitals must adjust workflows and standard of care protocols to accommodate these changes.

Another top concern is the interoperability of the different digital health solutions. With each company developing its own solution — some using their own proprietary system and some on different open systems — each is capturing and storing data in different ways, which prevents data integration and communication. To ensure solutions being developed can be integrated with other systems, vendors should develop their solutions according to interoperability standards.

The third top concern is patient privacy (e.g., data protection), and companies must also pay attention to regulatory developments in the region, given that data leaks have occurred in countries like Singapore and Australia. To mitigate the risk of such breaches, governments in the region are stepping up efforts to regulate the protection of patient data. Recent efforts to do so include those of Indonesia, Singapore and Thailand.

As digital health adoption continues to gain traction, medtech and pharma companies will need to continuously work with stakeholders to develop products and services and to address key concerns (patient privacy, product compatibility, etc.). Changes in workflow will need to be considered with the shift in customers’ (patient, hospitals, physicians, community care facilities, etc.) preferences and the adoption of digital tools as care extends beyond and/or shifts away from the hospital. With care circles expanding and users taking more control of their health, the data aggregation and back-end processes will need to ensure interoperability with existing and emerging digital platforms, be compliant and be user-friendly.

Due to restrictions on physical access to healthcare institutions during the pandemic, physicians have increasingly engaged with sales representatives via digital channels. In most APAC markets, leaders expect a return to “normal” by the end of 2021. In China and Japan, however, these restrictions on sales access are expected to persist (Figure 5).

Yet the new normal will likely be one where the use of digital channels remains high. In all markets surveyed, more than 20% of hospitals are already using digital tools to interact with pharma and medtech companies. In South Korea, Australia and Singapore, this figure is close to 40%. Informal channels play an important role; the informal channels used by physicians and sales representatives tend to be broadly used social applications such as WeChat in China, LINE in Thailand and Kakao Talk in Korea. This has in turn resulted in efforts to formalize these communications channels, for example, through official microsites and mini-apps embedded in WeChat.

Figure 5

Image
restrictions-sales-access

Figure 5

Image
restrictions-sales-access

Considering this shift toward digital channels, medtech and pharma companies need to rethink their sales operating models and — more broadly — their go-to-market strategies. For example, implementing remote selling could allow them to expand their geographical coverage while reducing travel. Strategies such as this can simultaneously improve productivity and cost-effectiveness, and extend customer reach and satisfaction. Financial benefits can accrue to hospitals, patients, shareholders or all of the above. Medtech companies, particularly those that are selling highly sophisticated devices that require hands-on support, will need to leverage digital tools to the extent of being innovative around how to incorporate augmented reality (AR) or virtual reality (VR) technology to simulate their presence and support as if they are beside the physician/surgeon.

With severe limitations on and uncertainty over in-person interactions, companies are adapting their strategies to maintain customer engagement. Some strategies that multinational companies MNCs are using include utilizing AR/VR technology for virtual “hands-on” device training and subject matter microsites that compile curated information. This information can be shared with target users in a tailored manner depending on their needs; for example, junior physicians prefer materials to improve their basic surgery skills, whereas senior physicians are more interested in advanced surgery techniques and complex cases. Depending on the strategy used, who the target providers are and the patients they serve, such information will need to be tailored to fit users’ needs and preferences. 

In both China and Japan, notwithstanding the ongoing pandemic woes, governments are continuing their ongoing efforts to contain drug costs. In China, we provide insights on the effects of VBP and NRDL policies. In Japan, the government recently announced further efforts to push for more hospitals to have formularies as well as increase usage of generics and biosimilars.

Japan’s Ministry of Health, Labour and Welfare recently committed to creating guidelines for formularies by 2022. The lack of guidelines and manpower has been cited by hospitals7,8 as one of the main factors holding them back from establishing formularies. With this drug formulary effort, the government aims to further encourage the use of generics and biosimilars. These two trends are supported by data from our study. Generic drugs are the second-highest priority for purchasing standardization by hospitals, following medical consumables. In addition, of the hospitals that have access to both originators and biosimilars, 6 out of 10 prefer biosimilars.

In China, there is an ongoing and accelerating effort to reduce “bought-in” costs for pharma and medtech using VBP, which has been shown to drive down prices by 90% or more.  

Lower prices have been made possible as pharma and medtech companies minimize sales and marketing costs. In pharma, where VBP is already more established, L.E.K.’s analysis shows pharma companies are visibly cutting back on commercial investment for VBP drugs (63% reduction in sales visits), implying the need for more cost-effective detailing. In contrast, VBP drugs that do not win the tender face a limited market as VBP covers about 70% of the market volume in relevant molecules/products. This represents a stark contrast to the pre-VBP markets where premium brands were able to secure both a price premium and high market share. 

Cost savings from drug procurement using VBP have in turn allowed for faster and wider coverage of innovative drugs in the NRDL. To become part of the NRDL, drug prices are also negotiated substantially lower in exchange for access to a wider market due to much improved affordability on a national basis. NRDL has shortened the timeline for innovative drug market access, but immediate hospital listing is not yet universally guaranteed (Figure 6). In reality, there are still barriers to listing, and prescriptions can “escape” to retail pharmacies (Figure 7); how to effectively capture the market outside the hospital has now become a key question for many pharma MNCs.

Figure 6

Image
nrdl-hospital

Figure 6

Image
nrdl-hospital

Figure 7

Image
prescription-hospital

Figure 7

Image
prescription-hospital

The provider context in APAC is evolving rapidly and remains uniquely uncertain. Medtech and pharma companies need to address a range of important issues as they develop their strategies for the coming period.

  • How have your customers been affected by COVID-19, and how have their priorities, financial health, spending patterns and purchase behaviors changed as a result? Which of these changes are transient and which are likely to be permanent?

  • What are the implications of any changes for your product portfolio and service offerings? Where are you better? Where are you less well positioned? How can you capitalize on your strengths while reinforcing weaker parts of the offering? How can you create win-wins for your customers at this unprecedented time?

  • What imperatives does the shift to digital create? In terms of where and how care is provided, how do customers prefer to engage? With the array of diagnostic and therapeutic approaches now possible, how should you respond?

  • Given changing hospital and healthcare provider (HCP) access as well as engagement preferences, how does your commercial model need to evolve, especially in those markets where COVID-19 has precipitated a radical departure from previous norms? Building on the prior point, how do you need to incorporate digital engagement into your commercial model going forward?

  • How is the emergence of new purchasing models — VBP and NRDL in China, group purchasing organizations and formularies in Japan — likely to affect your portfolio and engagement strategy? How should your plans and capabilities evolve as a result?

  • Overall, what is required to lead and win in this fast-changing market environment and in this diverse region? How can you continue to stay relevant and create value for your HCPs and their patients?

2020 has put APAC’s healthcare systems to the test, and the outlook is fundamentally uncertain. Keeping your finger on the pulse of hospital executives’ views will continue to be a key to success for medtech and pharma companies as the ecosystem settles into this new normal.

Endnotes

1APAC market coverage includes Australia, China, India, Indonesia, Japan, Singapore, South Korea and Thailand.
2GRG Health is a research firm specializing in the healthcare space.
3https://www.watoday.com.au/politics/western-australia/crisis-point-covid-19-blamed-as-wa-hospital-ramping-hours-reach-new-record-20201208-p56lp9.html
4https://www.smh.com.au/national/nsw/hip-and-knee-replacements-overdue-as-nsw-starts-on-surgery-backlog-20201207-p56ld7.html
5https://www.servicesaustralia.gov.au/organisations/health-professionals/services/medicare/mbs-and-telehealth 
6https://economictimes.indiatimes.com/wealth/insure/health-insurance/3-changes-in-health-insurance-from-oct-1-that-will-help-policy-holders/articleshow/76770101.cms?utm_source=contentofinterest&utm_medium=text&utm_campaign=cppst
7https://pj.jiho.jp/article/243496
8https://pj.jiho.jp/article/241030


English

UK Leisure Travel Recovery in 2021 Will Be Driven by Many Factors Beyond Vaccination

February 25, 2021

Image
leisure travel attitudes
Image
leisure travel attitudes

L.E.K.’s survey of 1,665 UK residents (conducted 26 January – 2 February) shows that half of respondents do not expect to return to pre-COVID-19 levels of leisure travel or at least not until there is effective ongoing management of COVID-19 (similar to the flu). In total, 22% of respondents state that they will not travel as often as they used to, even after the implementation of systems for health management (see Figure 1).

Only 27% of survey respondents tie their expected return to normal levels of leisure travel directly to the government’s vaccination programme. This shows that recovery in personal travel habits is likely to be prolonged and may take some time beyond the vaccination programme’s conclusion in autumn this year.

The survey findings also provide insights into how recovery in travel demand is likely to vary by different population demographics (see Figure 2).

Image
leisure travel / age and gender
Image
leisure travel / age and gender
  • Attitudes towards returning to normal levels of travel are correlated with age, with 60% of respondents over 70 years old unlikely to return to normal travel habits even after they have been vaccinated.
     
  • Women also appear to be more reluctant to return to normal levels of travel compared to men, with 25% stating that they will not travel as much as they used to (against 17% for men).
     
  • The survey also found that attitudes towards leisure travel do not appear to differ significantly across different regions of the UK.

Implications for the travel and transport industry in 2021

L.E.K. Consulting’s transport sector clients are rethinking how to forecast and plan their passenger businesses for rebuilding after the pandemic.

  1. Passenger demand: Almost one quarter of respondents indicated they would return to their normal leisure travel habits as soon as allowed. As restrictions are eased, transport companies should prepare to capture growth in demand through increased marketing spending.
     
  2. Leisure travel, always discretionary, may be even more so after COVID-19: Transport and travel companies will need to enhance their creativity and reach in marketing leisure travel if they want to rebuild towards pre-COVID-19 levels.
     
  3. Renewed importance of safety: The survey findings suggest travellers will retain some caution around travel even after the conclusion of the vaccination programme. Operators should carefully communicate the measures undertaken to ensure the safety of their customers in order to alleviate this concern.
     
  4. Financial resilience remains crucial throughout 2021: Operators, particularly those with a large pre-COVID-19 base of older customers, should not expect a full recovery in demand in 2021, and should maintain disciplined spending budgets to ensure ongoing resilience.
English

Before Jumping Into the Hydrogen Economy, Know the Pitfalls

Investors and business leaders need to separate hype from reality
February 18, 2021

Image
hydrogen investment opportunities
Image
hydrogen investment opportunities

How hydrogen is extracted determines how ‘green,’ practical and cost-effective it will be

The hydrogen economy is broadly attractive, but there are immediate challenges to hydrogen adoption. As of today, over 95% of the hydrogen used for industrial applications is extracted from natural gas, a process that, despite its relative economic advantages, represents a substantial threat to the environment given its high level of associated CO2 emission. This extraction method is known as the “black” (or “gray”) hydrogen path. It has been used for several decades, but now, there are increasing calls for its replacement.

More environmentally friendly extraction methods are on the way. Recent evolutions include carbon capture and storage (CCS) technology to help minimize CO2 emissions and make hydrogen production cleaner. This “blue” path is a good alternative from the economic and environmental standpoint, but still does not resolve the issue of high dependence on fossil fuel sources.

More recently, the increasing establishment of renewable infrastructure has triggered interest in the development of more “green” hydrogen extraction alternatives. These produce hydrogen from water via electrolysis, with zero associated emissions. The key challenge is to make this process economically viable at large scale. But given the obvious benefits of this green path, most investors are focusing on it, primarily by developing electrolyzer technology. But energy efficiency and cost-effectiveness remain the two major challenges that green hydrogen must overcome.

A wide range of distribution and storage methods and end-use scenarios add to the complexity

The complexities do not end with extraction. Distribution and storage present their own array of challenges (see Figure 2). Once extracted, hydrogen exists in a gaseous or liquid state. Neither is easy to distribute or store. On the distribution side, logistical improvements that drive reduction in transmission and distribution cost are expected to be the most important ways to increase the cost competitiveness of hydrogen relative to other renewable energy sources. Scale factors point to the evolution of distribution hubs. In terms of storage, the two most mature solutions are liquid hydrogen, which must be maintained at extremely low temperatures, or compressed gaseous hydrogen. The cost of these storage methods and the energy density that can be stored by each method present scale-limiting drawbacks. Research continues into alternative methods, including solid-state storage and liquid organic hydrogen carrier (LOHC) technology.

Image
hydrogen transportation
Image
hydrogen transportation
Image
usage of hydrogen
Image
usage of hydrogen

The challenge for investors and businesses fearing a missed hydrogen opportunity: separate the hype from the reality

Those who want to take advantage of the emerging opportunity and business leaders who plan to participate through partnerships or acquisitions should proceed with caution. The hydrogen value chain has many elements and there are many points of entry (see Figure 4). Most critically, the time horizon for commercial realization varies widely by region and by the maturity of the local hydrogen infrastructure. 

Image
hydrogen markets
Image
hydrogen markets

It’s essential to understand the specifics of each value chain application — the cost and carbon impact of production, the logistics of hydrogen delivery, the timeline for the introduction and full realization of each hydrogen use case, and the local government’s plan to facilitate its development. Only then may hydrogen be fit into a company’s investment strategy, operations or integrated resource plan.

  • It’s critical to know the value chain. There are many relevant, strategic and attractive investment entry points across the hydrogen value chain. In hydrogen production, hydrolysis technology (particularly alkaline, polymer electrolyte membrane and high temperature electrolysis) is attracting most investment interest given its relevance to the realization of the green path. It presents challenges related to cost-effectiveness and energy efficiency. For storage, the cost and energy density drawback limitations are driving more research in solid state or LOHC storage.
     
  • Be mindful of production costs and regional competitive advantages. Fuel input cost and capital expenditures are the two most important categories driving hydrogen production economics. For black (gray) hydrogen from natural gas, fuel — the largest cost component — accounts for between 45% and 75% of production costs. Low gas prices in the Middle East, Russia and North America give rise to some of the lowest hydrogen production costs. Gas importers like Japan, Korea and India have to contend with higher gas import prices, which makes for higher hydrogen production costs from steam methane reforming and partial oxidation processes. On the green hydrogen front, dynamics are similar, but in contrast will favor regions with a large installed base of onshore solar and wind resources. In this case, gas importers with high solar penetration, such as Japan, may see green hydrogen as the only economic pathway, while countries targeting a balanced energy mix, such as the U.S., must consider the black vs. green tradeoffs.
     
  • End-use applications will mature over time — but large-scale adoption will take longer and for some applications will be measured in decades rather than years. Some hydrogen applications will arrive within the next few years. Hydrogen-powered forklifts are already a reality, and cars and urban buses will reach full maturity by mid-decade. Others applications will take longer. Building heat and power partly based on hydrogen will be mature in 2030, but pure hydrogen heating will take another 10 years for widespread adoption. The timeline for industrial energy is similar. Hydrogen for industrial production of feedstock, methanol, benzyne and steel will appear in stages over the next 20 years. Hydrogen-based synthfuel for cargo ships and large airplanes will not begin to arrive until 2030 and won’t reach full maturity until closer to 2050.
     
  • Government policies will drive demand. Increasing demand for hydrogen is in part promoted by government legislation in several countries, allowing for faster adoption of hydrogen in the power/fueling system. According to recent research conducted by the International Energy Agency (IEA), the number of countries with policies that directly support investment in hydrogen technologies is increasing, along with the number of sectors they target. However, most government dollars today are allocated to transportation solutions, as battery solutions for long-haul commercial vehicles remain limited.

Examples of these policies include Australia’s Clean Energy Finance Corp. (CEFC) announcement that it will provide incentives for transportation end-use investments, as well as the “Hydrogen Global” initiative promoted by the World Energy Council and backed by multiple countries, corporations and institutions in order to support energy decarbonization programs. In addition to Australia, other relevant countries/regions promoting a higher use of hydrogen include Europe (led by France, Germany and Norway), China, Japan, Russia and the Middle East (led by the United Arab Emirates).

In developing your own strategy for hydrogen participation, and in considering specific investments, ask these questions:

1. What are the emerging hydrogen technologies and initiatives currently in development? In the search for attractive investment opportunities in the hydrogen sector, investors must first understand the technology landscape of current and emerging solutions in development along the hydrogen value chain, including production and conversion (e.g., green hydrogen, electrolysis, biomass conversion), storage and transportation/distribution (e.g., stations, networks), and end-use applications (e.g., transport and mobility, industrial feedstock).

2. What are the key enablers to commerciality, and over what period of time will they be realized? The wide gap between hydrogen technologies in a conceptual phase and actual solutions currently being implemented in the field makes the question of commerciality highly sensitive for investors. While looking at the options, investors must develop a deep understanding of the technology maturity life cycle, the commercial viability (e.g., upfront investment, operating costs, scalability) in current versus future adoption conditions, the technical viability (e.g., technology readiness, appropriateness in addressing stakeholder needs and innovativeness) and the strategic advantages of hydrogen technologies versus alternative solutions (e.g., efficiency, density, footprint, maintenance, life span).

3. Which companies are positioned to benefit from those technologies? How does the investment scenario and timeline for technologies impact individual companies? What are the implications for feasibility, cost and time to market? Which companies are in the lead today, and which are building a capabilities system enabling a sustainable competitive advantage?

4. How should investors and companies think about portfolio fit and synergies? Finally, players must look into their own portfolios and carefully assess the potential fit of hydrogen technologies and companies in their mix, considering not only financial and commercial elements but also the feasibility of leveraging current capabilities and relationships that can potentially drive opportunities and risks for their respective integrated businesses.

With those answers in hand, investors and strategic participants can proceed to develop fully informed strategies for the emerging hydrogen economy. Make no mistake — hydrogen is an extremely promising and remarkably versatile energy source. It has the potential to be truly transformative and to open the door to a greener future. But as we’ve only described briefly, there are many complexities, and the risks and barriers can easily trap the impulsive or ill-informed. Knowing the issues and the pitfalls is an essential step toward investments and ventures that will ultimately deliver on the hydrogen promise.

English
Subscribe to