The Great Reopening and Priority Reset: Consumer Insights — Edition 1, Part 4

Spotlight on home goods, return to office and winter holidays
December 7, 2021

Since the beginning of the pandemic, L.E.K. Consulting has been at the forefront of understanding how consumer behaviors are changing. Through a recurring U.S. consumer pulse survey, L.E.K. has reported on evolving consumer dynamics as well as the outlook for a post-pandemic world.

Our latest survey includes responses captured Nov. 2-5, 2021, from ~1,000 U.S. consumers who are demographically representative of the general population. In this iteration, we have focused specifically on the home goods sectors, the upcoming 2021 winter holidays, and return to office behaviors, in addition to our other recurring questions regarding overarching consumer spend and behaviors across categories.

We first wanted to understand how consumers’ perception of the severity of the pandemic has evolved, and to what extent the pandemic continues to factor consciously into consumers’ daily decisions. While most consumers (88%) do not believe the pandemic is fully contained, only 17% say they are very concerned about it and that it influences their day-to-day behaviors significantly (down from 26% in July 2021). 

Important note: All forward-looking data reported is a reflection of consumer sentiment/expectations and is not an official L.E.K. forecast. Additional surveys can be found at the L.E.K. COVID-19 Insights Center

Image
most consumers do not believe
Image
most consumers do not believe

Consumer-reported spend levels for dining out, gyms and other categories remain dampened

Our survey revealed findings similar to L.E.K.’s June 2021 consumer pulse survey.

Among the 88% of U.S. consumers who believe the outbreak is not fully contained: For these consumers, spend levels across categories continue to be impacted. Categories with slightly higher than pre-pandemic spend levels include groceries, takeout/delivery, vitamins/minerals/supplements, medicine/medical supplies, personal electronics, personal care products and pet food/treats. Categories where spend remains below pre-pandemic levels include dining out, digital fitness subscriptions, gym/fitness services outside the home, movies/concerts/sporting events, apparel/footwear/accessories and taxi/Uber/Lyft.

Image
Consumer-reported spend levels
Image
Consumer-reported spend levels

Consumers expect post-pandemic spend levels to regress to pre-pandemic levels for most categories

Consumer expectations for future spend levels, once the outbreak is fully contained and/or sufficiently managed, are largely a regression to pre-pandemic spend levels for most categories. However, spend is expected to remain slightly diminished for use of taxis/Uber/Lyft in the future.

Notably, consumers’ expectations for future spend levels have moderated over time. For example, our earlier consumer surveys suggested grocery would maintain higher levels of spend relative to the depressed spend for dining out. Consumers also anticipated spending more on their pets over time, but this expectation has also moderated over time (although there are net more pets than pre-pandemic).

Anticipated future spend on taxi and ridesharing has been the most volatile and least consistent over time. Most recent consumer expectations indicate spend will be just below pre-pandemic levels, while July 2021 expectations suggested it would experience stronger declines in future spend. These changes could be the result of a number of factors, such as cooler fall weather, anticipated holiday travel plans revealing a greater need for these services than was evident during the summer months and improved (yet still restrained) driver volumes.

Image
post-pandemic spend levels
Image
post-pandemic spend levels

While many in-person activities remain dampened, they are recovering and expected to rebound

Across activity types, frequency has certainly improved since the start of the pandemic but still remains dampened relative to pre-pandemic levels in many areas: visiting friends and family, going to the spa, going to live events, going to bars/restaurants, etc. 

Post-pandemic, consumers expect activity levels to rebound strongly. However, going to the gym may remain slightly below pre-pandemic levels, particularly as connected fitness and at-home workouts have proliferated over the past 18 months. Going to the bar/nightclub may also remain slightly below pre-pandemic levels.  

Where and how consumers work is also changing. In April 2020, the high point of statewide lockdowns, consumers spent only ~34% of their time in an office setting. This number is now ~55% (consistent with July 2021 results) and is expected to reach a peak of ~61% post-pandemic. Consumers currently spend ~33% of their time working at home and expect that to dip only slightly to ~27% post-pandemic. Overall, post-pandemic work-setting expectations have remained highly consistent from April 2020 through November 2021, and consumers anticipate spending more time working from home in the future than they did before the pandemic.

For the consumers who expect to work more at home post-pandemic, they feel that working at home helps minimize commuting, gives them flexibility and enables them to save more money. 

Image
post-pandemic participation levels
Image
post-pandemic participation levels
Image
the amount of time spent working from home
Image
the amount of time spent working from home
Image
How much time consumers spend
Image
How much time consumers spend

About half of office workers report that employers have an in-office full-time policy

Fifty-one percent of U.S. consumers who have traditionally office-based jobs indicate their employer currently has an in-office full-time policy. Seventeen percent are under a hybrid model, while another 17% are fully remote. Nine percent indicate the location is up to the employee, and 6% report no formal policy at this time. 

Overall, among all consumers with office-based jobs, ~77% indicate that they usually go to the office at least once per week. The average number of days spent in the office is ~3-4 days per week (for those going into the office in any capacity).

Employer decisions regarding work policies seem to reflect employee preferences, as consumers who operate within a fully in-office model demonstrate a preference for the office setting, while those who are remote, hybrid, flexible, or do not have a policy prefer to work remotely. 

Policies also seem to reflect perceived productivity levels. For example, those fully in-office report higher levels of productivity in the office versus in a remote setting. Those not in the office full time report relatively similar levels of productivity whether in the office or in a remote location. However, fully remote workers report higher productivity levels in their remote locations than in the office setting.

Image
Return to office policies
Image
Return to office policies
Image
Employees working in the office
Image
Employees working in the office

The pandemic has driven substantially more time spent in and dollars spent on the home, and many consumers expect this to continue over the next ~3 years. We found that:

More time at home is expected to persist: Not surprisingly, consumers reported more time spent in all areas of the home during the pandemic, particularly the living room, followed by the kitchen, home office and backyard/outdoor area(s). Post- pandemic, consumers will continue to spend more time at home — again, primarily in the living room and kitchen, but also outdoors or in the backyard. Time spent in the home office will drop but remain above pre-pandemic levels as consumers return to offices.  

Spend on the home was a mix of planned/unplanned and pandemic-related/-unrelated spend: An analysis of why home goods purchases were made during the past two years (during the pandemic) reveal a few insights. First, there were clearly some categories that saw a disproportionate number of “unplanned” purchases. Many but not all unplanned purchases were for pandemic-related reasons; however, the minority of these purchases were true pull forward of future demand versus  incremental to category. These categories include home office, backyard recreation and outdoor furniture. Other categories were less affected and were purchased primarily for planned reasons (~80%+), for reasons such as replacement, home turnover or aesthetic remodels. 

Long-term, continued investment in the home is expected: A majority (52%) of consumers said they expect to increase spend in at least one of the home goods categories in the future (“over the next 3 years”). This indicates a longer-term investment in the home among consumers. In general, we would expect that more time spent at home in the future would support continued investment in the home even once the pandemic is fully contained.

Image
Consumers expect more time
Image
Consumers expect more time
Image
degree of pandemic-related sales
Image
degree of pandemic-related sales

Most consumers expect their increased investment in the home to continue for the next 3 years

Consumers are investing in the home for several key reasons. We found that core market drivers such as replacement, decor refresh and housing turnover remained the primary purchase motivators. This finding applies to nearly all categories of home goods. 

In addition, the majority of consumers (52%) expect to permanently increase their spending on home goods in the next three years. Twenty-six percent expect to permanently increase spending in three or more areas of the home. 

Image
core market drivers such as housing turnover
Image
core market drivers such as housing turnover
Image
expect their spend on home goods
Image
expect their spend on home goods

For the 2021 holidays, consumer sentiment appears pessimistic, but actual spend levels appear stronger

We asked consumers if they expect to spend more, less or the same during the holidays this year relative to prior years. While roughly half (53%) of consumers expect to spend roughly the same amount of money on holiday gifts in 2021 relative to 2019, a substantial portion of consumers report that they anticipate spending slightly less (15%) and significantly less (17%) this year. The anticipated drop in spend is driven by a few reasons: consumers say they have less money to spend, anticipate seeing fewer friends and family, and/or expect to purchase lower-priced gifts. 

However, recent consumer spend data suggests that consumer sentiment may not be the best predictor of holiday sales. The Census Bureau has reported a positive trend in monthly sales with September’s retail sales (excluding motor vehicles/parts) up 14% over September 2020 and up 25% over September 2019. Other secondary sources have also reported a more positive outlook for holiday spend this year. This disconnect between consumer sentiment and actual spend has been observed frequently this year; consumers are pessimistic about the economy, even though it is arguably doing well overall.

Most (86%) consumers are aware of current supply chain disruptions that may impact holiday gift availability. As a result, 70% of consumers say they plan to adjust their purchasing behavior this holiday season. For example, respondents are planning to order gifts earlier than usual, purchase fewer gifts and/or purchase alternatives to gifts they would normally purchase (locally made products, gift cards, etc.).

Online shopping for holiday gifts is expected to increase to 50%-60% of all gift purchases (+10-20 ppt for online purchases relative to 2019). 

Image
consumer sentiment appears somewhat pessimistic
Image
consumer sentiment appears somewhat pessimistic
Image
consumers are aware of supply chain issues
Image
consumers are aware of supply chain issues
Image
purchase a larger share of gifts online
Image
purchase a larger share of gifts online

In sum

This is our final edition of The Great Reopening and Priority Reset Series for the year 2021. For previous editions in the series and additional COVID-19 insights, please see our COVID-19 Insights Center.

We understand that many of our clients are facing continued uncertainty in their business outlook as the ebb and flow of COVID-19 continues. Some of these changes are likely to endure well beyond when the current pandemic has passed. While many changes will create challenges, new opportunities will also emerge. We will continue to share our ideas and insights through our website and other media over the coming months.

We wish good health to you and your loved ones, happy holidays, and a happy new year. We look forward to continuing to support our clients through these changing times.

To continue the discussion, please don’t hesitate to contact us.

Chris D'Angelo, Manager, contributed to this report.

English

In Their Own Words: Contrarians Discuss ESG and the Energy Transition in Oil and Gas

December 2, 2021

Throughout this series on the L.E.K. Consulting 2021 Energy Transition Study, we’ve discussed key findings on energy transition investments in the oil and gas industry. Although strategies differ, the industry in general is responding to improving economics as well as growing public and investor support for decarbonization. This trend in turn has implications for environmental, social and governance (ESG) goals and sustainability

But that doesn’t mean all 261 of our survey participants see every issue the same way. So, in this final installment of our series, let’s turn the podium over to the contrarians. Here’s what they have to say about priorities, technology and the pace of change in the energy transition. 

Oil-and-gas-focused respondents versus ESG and energy transition supporters

Not all respondents agree that oil and gas companies are changing, or that priorities should shift from traditional businesses. 

“Majors should focus on reinvigorating the entire energy structure instead of blowing money on solar and wind. Returns are so low. Over time, you’ll find that the companies that invest here [will] start to lose their margin profile.”

“The majority talk about energy transition, ESG efforts, etc. But they are doing [little] to get there. The [ESG targets] a lot of people are putting out are numbers they have already hit.”

“There’s no synergy with energy transition — you may as well start from scratch. Transforming from traditional to renewable energy, if you have no intrinsic value, is bizarre to me.”

“[The energy transition] is overpriced. Everyone knows it is the future. However, a lot of zeros will be generated from these companies. The valuations are on extreme forecasts, so it’s hard to underwrite [the] cost of capital.”

“I wouldn’t touch solar and wind — crazy valuations. These are basically infrastructure projects with 5% cost of capital. I don’t know how you make any money on those long term.”

Speed of energy transition and ESG models

Some energy executives have doubts about how quickly the industry can change, or how good these changes will be for businesses. 

“There are notable majors playing a leading role, but I question the pace at which they should be doing it. Demand for fossil fuels will still be robust in developing economies, so companies will have to balance [the transition].”

“Majors have the assets and the capital to fund the transition. However, those companies are so large that change from them may be slow.”

“Companies will have to balance this vision with creating value for [investors].”

Viability of technology

Debates persist about the profitability or scalability of most energy transition technologies.

“[We’re] looking to capture carbon from gas production to produce hydrogen. However, none of this is affordable [today], so [it’s] difficult to push on a larger scale without government support.”

“Many of the energy transition markets today are artificial, meaning they are supported by policies in Washington. The winds can blow [in] a different direction in a few years if there is an administration change. That makes it difficult to trust the solutions will come down the technology curve if policy support is cut off.”

“With tax incentives, we may see people move to carbon capture. Today, people can’t make money doing it.”

English

Ready for Take-Off — Opening Our International Borders

December 1, 2021

Key takeaways

With international borders reopening, there is evidence of significant pent-up demand for international air travel to and from Australia.

The speed of recovery for international inbound visitor traffic will be dependent on government restrictions on entry and quarantine, and assuming that full vaccination will be an entry requirement for non-Australian citizens/residents.

Visiting friends and relatives (VFR) will be the first inbound market to return, followed by inbound leisure/holiday travel.

Constrained aviation capacity in the short- to medium-term will likely lead to higher real airfares, which could act as a drag on demand for international air travel.

The reopening of international travel from November 2021 has been welcome news for the aviation industry. For the first time since the pandemic began and Australian international borders were closed, we can speculate with a heightened degree of confidence on the Australian international aviation recovery.

We now have clarity on the international travel opportunities available to double-vaccinated Australians. Bookings are being taken to a number of “COVID-safe” countries, including the United Kingdom, the United States, Japan, Singapore, Canada and Fiji. Numerous reports have highlighted the strength of demand by Australians eager to fly internationally over the Australian summer. This is entirely consistent with consumer research, including L.E.K. Consulting market surveys, that has highlighted a high degree of pent-up demand for international travel.

Moving beyond the Australian summer, we foresee a number of medium-term (2022-25) “tailwinds” and “headwinds” to international growth.

Demand for air travel

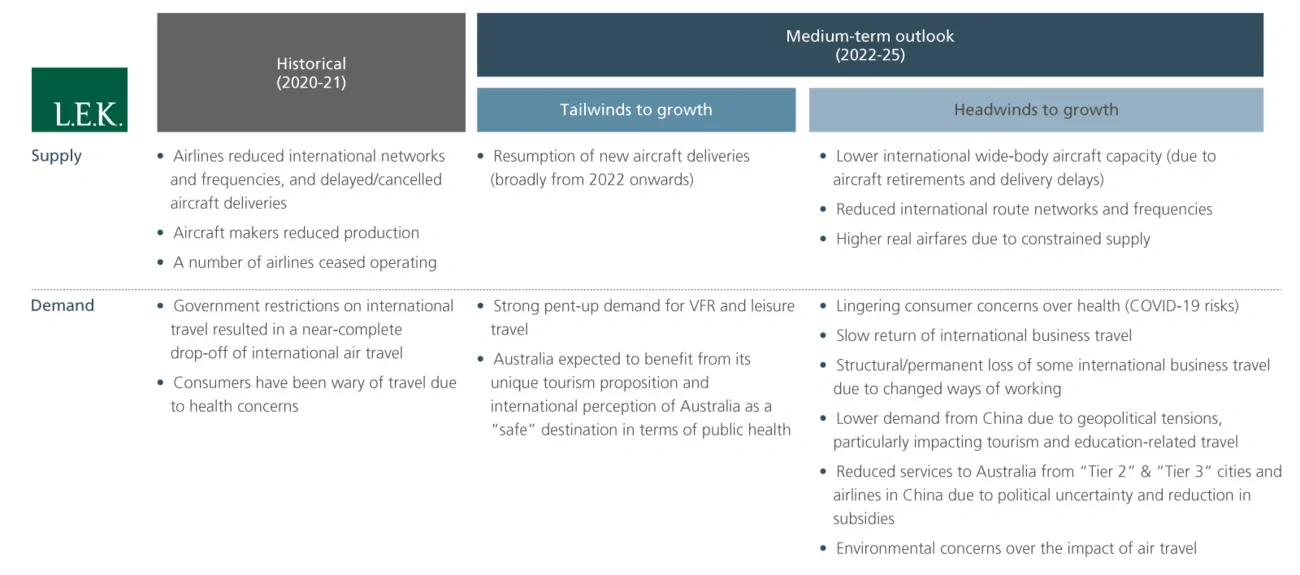
There is evidence of significant pent-up demand for international air travel to and from Australia, particularly for visiting friends and relatives (VFR) and leisure travel. Consumer research indicates the outbound traveller segment will be first to return as the Commonwealth and state/territory governments relax restrictions on Australians travelling overseas.

A recent L.E.K. consumer survey indicated that most Australians, particularly VFR travellers and younger cohorts, plan to take more international trips post-COVID-19 than they did pre-COVID-19, in part to “make up for lost time”. However, in the near term some traveller segments (e.g. older travellers) may delay a return to international travel due to health concerns and the greater complexity/cost of travel.

Inbound visitation to Australia will be slower to return, but the key underlying macro demand drivers (e.g. GDP, population growth, VFR travel to Australia, interest in Australian holidays) are expected to remain supportive of growth. Traveller surveys continue to indicate strong interest in visiting Australia as a unique location that has developed a reputation as a “safe” — albeit restrictive — destination during the pandemic.

The speed of recovery for international inbound visitor traffic will be dependent on government restrictions on entry and quarantine, and we assume that full vaccination will be an entry requirement for non-Australian citizens/residents.

VFR will be the first inbound market to return, followed by inbound leisure/holiday travel. Amongst Australia’s largest VFR and leisure markets, New Zealand, the UK, the US, China, Singapore and Japan have made good progress with their vaccination programs, with between 50% and 80% of their populations vaccinated. However, the likes of India, Vietnam and the Philippines have lagged behind, suggesting that reopening to these markets will take longer.

International business travel will be slower to return and will be dependent on corporate/business decisions on budget, employee health and safety, and on the risk of being caught out by changing government travel restrictions. It will also be driven by the return of conventions and other large-format gatherings.

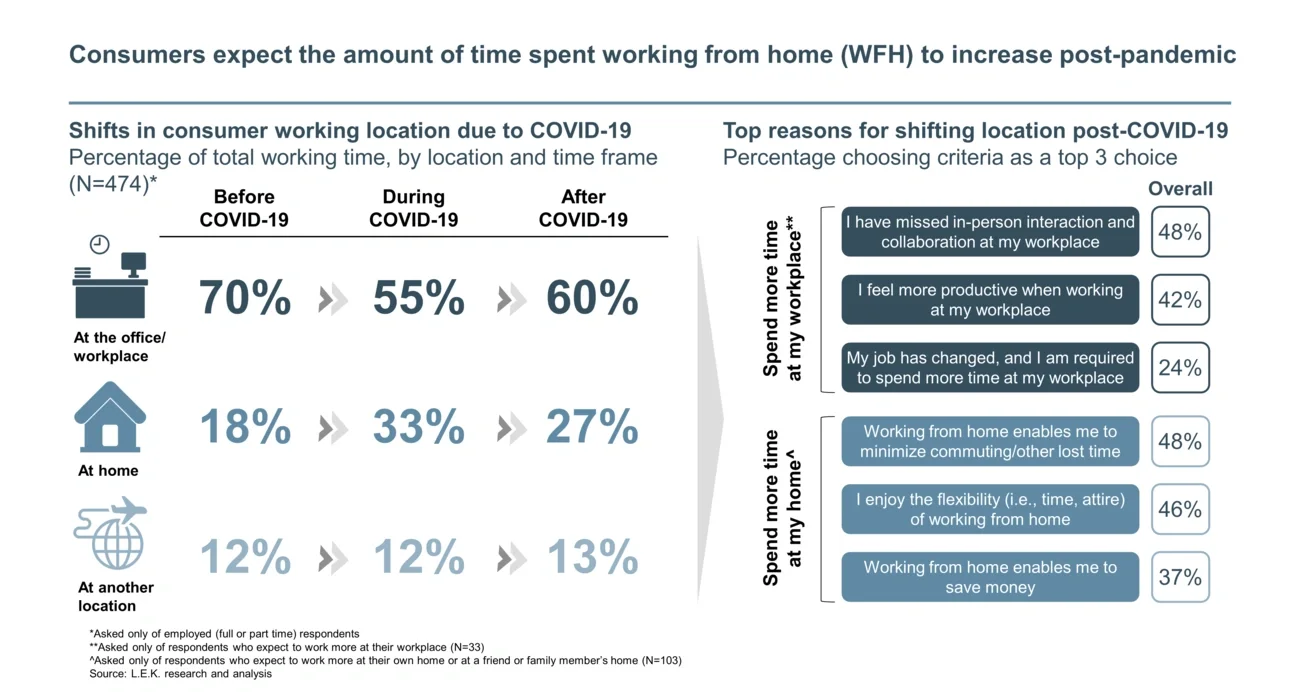
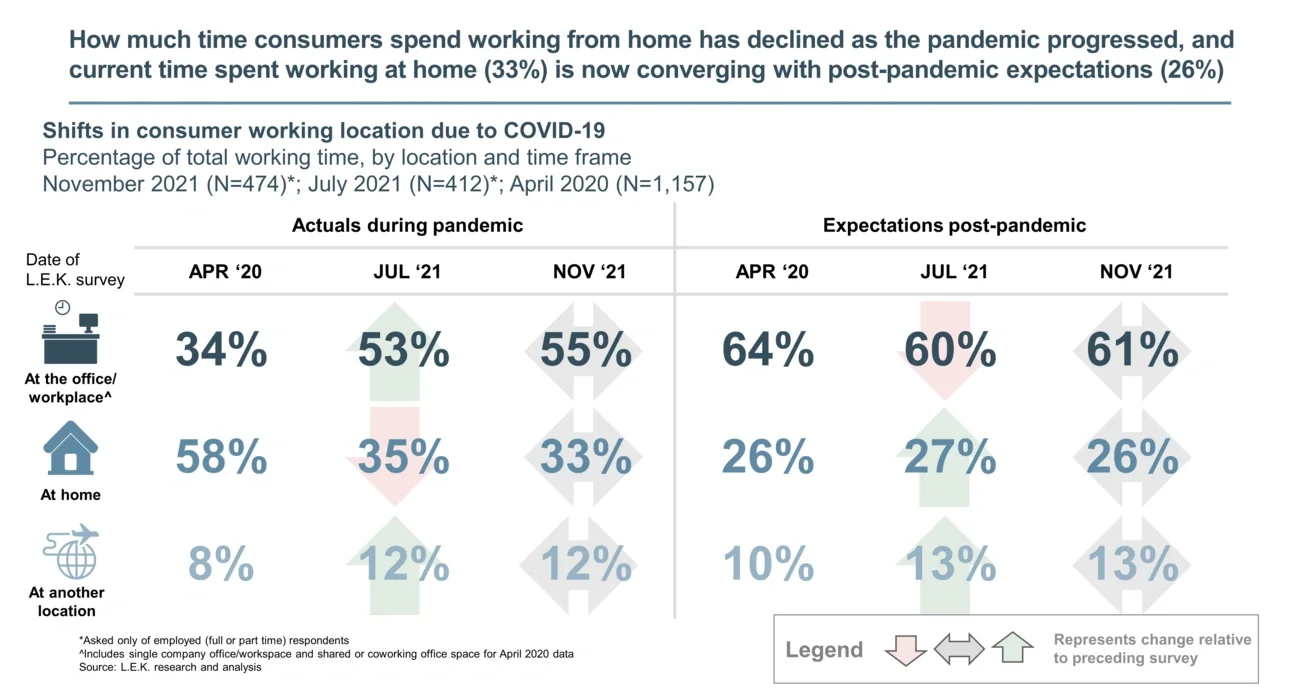
Business surveys suggest that there could be a medium-term structural impact on international business travel as a result of changed ways of working (i.e. videoconferencing), as well as a near-term impact based on business risk assessments related to health and changing border restrictions.

There is also a potential medium-term structural impact related to Australia’s political relationship with China, with broad implications for the VFR, leisure, business and education traveller segments.

Supply of aviation capacity

From a supply-side perspective, the international capacity of Australian carriers was materially reduced during the pandemic. Virgin removed all 11 wide-body aircraft from its fleet (B777s and A330s), although the airline can continue to operate short-haul international flights to New Zealand and parts of Asia with its fleet of 737-800s. Qantas currently has c.11% fewer wide-body aircraft in its fleet versus in January 2020, driven by early retirement of six B747s. At present, Qantas has announced plans to reactivate only five of its 12 A380s in 2022, with two of the 12 to be retired and the remaining five to remain in storage. Like Virgin, the Qantas Group (inclusive of Jetstar), has narrow-body aircraft (B737s and A320s) that can serve New Zealand and parts of Asia.

The bigger supply risk to the Australian international market is the potential loss of frequency, capacity and destinations provided pre-COVID-19 by international carriers, which account for the majority of international capacity to and from Australia. International airlines will return services to Australia as travel restrictions ease, but they will likely operate with lower frequencies and capacities in the near term across all Australian destinations.

There is also a risk of reduced services to Australia from “tier 2” and “tier 3” Chinese cities facilitated by Chinese airlines due to political uncertainty and reduction in subsidies.

Constrained aviation capacity in the short- to medium-term will likely lead to higher real airfares, which could act as a drag on demand for international air travel.

However, in a positive sign for aviation capacity, airlines — both international carriers and the Qantas Group — should see a resumption of new wide-body aircraft deliveries in 2022, which will begin the process of returning fleets to their pre-COVID-19 sizes.

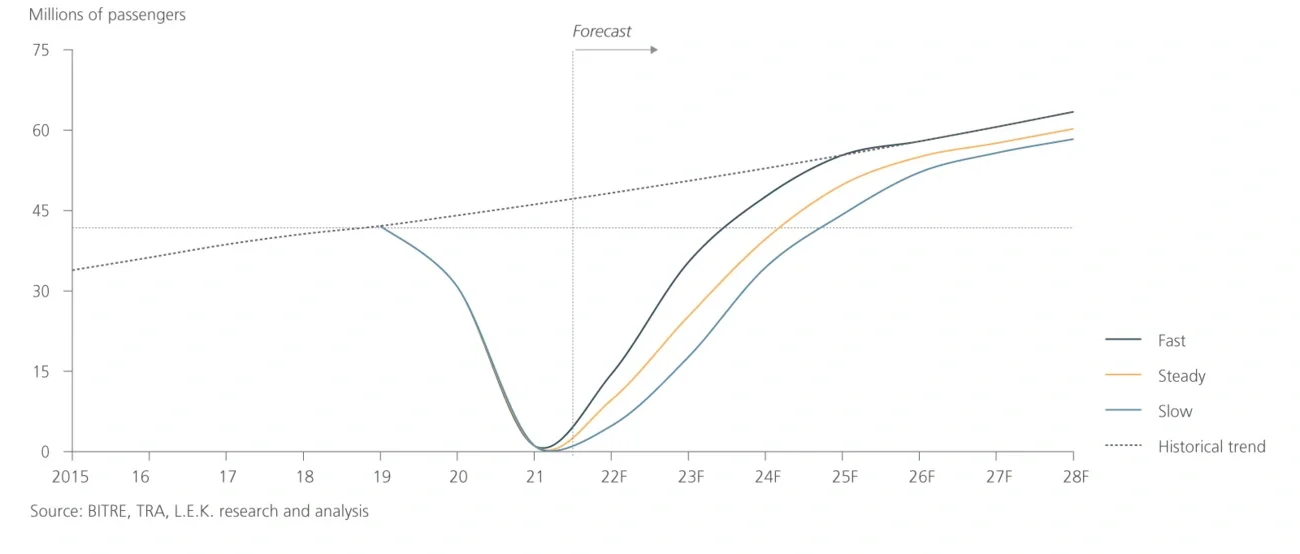
The figure below summarises these impacts:

Figure 1

Summary of supply and demand drivers over the medium term

Image
supply and demand drivers

Figure 1

Summary of supply and demand drivers over the medium term

Image
supply and demand drivers

Previous shocks to the aviation industry (e.g. SARS, 9/11, the Ansett collapse) had relatively rapid recoveries to a growth trend and little or no impact on long-run growth.

We believe COVID-19 has been different. This shock has been far deeper and lasted far longer; has accelerated trends towards remote working and virtual meetings; and has coincided with a rise in both geopolitical tensions and sensitivity to the environmental impact of air travel.

As a result, we believe there could be a structural reduction in air travel demand that leaves the industry approximately one to two years behind its long-term growth trajectory rather than returning to trend.

Pre-COVID-19, international air travel to/from Australia was forecast to grow at c.4%-5% p.a. to 2025. We still believe that to be a reasonable rate of growth once the industry recovers, as the traditional underlying macro drivers of international air travel appear fundamentally unchanged as a result of COVID-19.

However, several structural impacts may mean that international air travel sits below the pre-COVID-19 trend:

  • Lower international business travel to/from Australia
  • Lower inbound travel from China, particularly related to education and tourism
  • Slightly lower inbound leisure and VFR travel, due to constrained aviation capacity, higher real airfares and double-vaccination requirements for arriving visitors

L.E.K. has prepared a set of scenarios to illustrate potential international air travel recovery profiles over the medium term relative to pre-COVID-19 growth projections. Each scenario reflects a different set of assumptions about supply constraints and demand drivers. The three recovery profiles leverage data on market drivers, our views on market trends, and L.E.K. experience from recent travel and tourism projects.

  • Steady resumption (base case): Following a successful domestic Australian vaccination program and the staged reopening of borders, Australians begin to return to outbound international travel, particularly for VFR. International inbound travel begins to resume in 2022, but is dependent on government vaccination requirements and restrictions on travel to/from certain countries. There is a degree of structural loss (5%) due to lower business, China and inbound leisure/VFR travel.
  • Slow resumption: A slower roll-out (or stalling) of overseas vaccination programs results in slower and longer reopening of Australia to the world, delaying the ability of Australians to travel to certain countries and of overseas visitors to come to Australia. There is a higher degree of structural loss (8%) due to lower business, China and inbound leisure/VFR travel.
  • Fast resumption: A rapid roll-out of global vaccination programs and limited restrictions on inbound visitors result in a faster reopening of Australia to the world. Australia is seen as a desirable destination to visit due to its uniqueness as a holiday destination and its success in handling public health and safety during the COVID-19 pandemic. There is no structural loss related to business travel, Australia’s relationship with China or visitor vaccination/quarantine requirements.

As Figure 2 shows, international air travel would return to pre-COVID-19 levels by c. 2023-25 under the steady resumption base case, but would sit below the long-term pre-pandemic growth trend.

Figure 2

International passengers (FY2015-28F)

Image
International passengers

Figure 2

International passengers (FY2015-28F)

Image
International passengers

Under the slow resumption case, international travel would return to pre-COVID-19 levels by c. 2024-25 and also would sit below the long-term pre-pandemic growth trend. 

Under the fast resumption case, international travel would return to pre-COVID-19 levels by c. 2023 and would resume the pre-COVID-19 growth trend by c. 2025. However, this would be dependent on an expansion of aviation capacity above pre-COVID-19 levels, affordable airfares, the rebuilding of route networks, few or no travel restrictions, and a benign political relationship with China.

Notwithstanding potential structural losses in coming years, we remain optimistic about the recovery of international air travel on the back of significant pent-up traveller demand. We hope that COVID-19 has been a once-in-a-generation shock, and we look forward to getting back in the air ourselves.

English
Executive Insights

Personalized Nutrition: Riding the Tailwinds of Consumer Awareness

December 3, 2021

Key takeaways

Several factors, including COVID-19, have had a considerable impact on consumer awareness of personalized nutrition (PN).

This increased awareness has resulted in a highly favorable environment for categories like PN, creating tailwinds that may outlast the pandemic.

L.E.K. Consulting recently conducted a survey of around 1,900 consumers to determine awareness of PN solutions and level of interest in the category.

While PN providers face challenges to broadening the customer base and expanding adoption, following certain guidelines may help them take advantage of current opportunities.

PN has long appealed to a small segment of consumers. But the confluence of several factors, including the ongoing pandemic, has increased awareness of PN, creating a potentially broader audience for brands that are able to address certain core challenges. 

PN solutions are nutritional supplements that are assembled for an individual consumer based on some type of selection criteria — often technology-enabled — including surveys, DNA/biomarker tests or data gathered from wearable devices. They are generally sold on a subscription basis, and depending on the provider, may include ancillary services such as eating and exercise advice, weight management plans, or tracking apps. 

L.E.K. Consulting recently conducted a survey of around 1,900 consumers to determine their awareness of PN solutions and test their level of interest in the overall category.

Consumer awareness of PN services was moderate pre-COVID-19, with only 39% of all respondents saying they had heard of the services prior to the pandemic. Even fewer (7%) said they had actually subscribed to a PN service, a statistic that may well be overstated. Awareness was higher among younger versus older population segments.1 Awareness of individual PN brands or services was even lower than category awareness. Among the leading PN providers tested — Persona, HUM, Care/of, Vitagene, Thorne, Rootine and Baze — none garnered more than 20% recognition, an indication that there is plenty of opportunity to break away from the pack with the right brand strategy (see Table 1).

Table 1

Leading personalized nutrition brands

Image
nutrition brands

Table 1

Leading personalized nutrition brands

Image
nutrition brands

Figure 1

Respondents who became aware of PN due to COVID-19

Image
awareness of PN due to COVID-19

Figure 1

Respondents who became aware of PN due to COVID-19

Image
awareness of PN due to COVID-19

Overall, consumers say they are interested in tech-enabled PN solutions, with 78% expressing at least some interest2 and 40% expressing high interest.3 Younger population segments, who tend to be more comfortable with technology, were more likely to say they were interested in tech-enabled PN solutions, with close to 90% of 18-to-44-year-olds expressing some interest.4

As the pandemic upended life everywhere, many consumers became more concerned with health issues in general, with some embracing healthier lifestyles, including stress reduction, exercise and better eating habits. This has resulted in a highly favorable environment for categories like PN, creating tailwinds that we believe will outlast the pandemic itself. Indeed, increased concern about health in general was the most important reason for increased interest in PN services due to COVID-19, cited by 48% of respondents.

Furthermore, COVID-19 and the vaccines developed to combat it have shined a spotlight on how differently people respond to illnesses and medical treatments. We see stories to this effect in the news on a daily basis. The idea that people are subject to differing health outcomes may be partially responsible for an increased interest in personalized medicine. Notably, a significant portion (43%) of respondents who attributed their increased interest in PN services to COVID-19 said the main reason was belief that PN solutions provide better results than generalized solutions.

Interestingly, when asked to rank which sources of information were most helpful in making a purchasing decision, online reviews came out on top: one-third (33%) of subscribers chose online reviews as their No. 1 source, compared with less than a quarter (23%) who chose physician or healthcare practitioner recommendations. This is a strong indication that peer reviews are a major source of influence in buying decisions within this category (see Figure 2).

Figure 2

Reasons for subscribing to a PN service

Image
Reasons for subscribing to a PN service

Figure 2

Reasons for subscribing to a PN service

Image
Reasons for subscribing to a PN service

Not everyone is sold on PN solutions. The largest barriers by far to consumer adoption of PN solutions are concerns about price and value. Among nonsubscribers, 38% said they had chosen not to subscribe because they didn’t see the services as being worth the price, while the same number felt PN was simply too expensive (see Figure 3). A smaller percentage pointed to concerns about privacy or convenience as reasons to forgo PN services.

Figure 3

Reasons for not subscribing to a PN service

Image
Reasons for not subscribing to a PN service

Figure 3

Reasons for not subscribing to a PN service

Image
Reasons for not subscribing to a PN service

In order to probe a little deeper into the consumer mindset, we asked respondents to describe features of an ideal PN service. To avoid focus on cost, we asked them to assume the service was available at an affordable price point. We found that the most commonly desired features were healthy meal/snack recipes (43%), a PN plan based on a questionnaire (34%), and personalized exercise advice and guidance (33%). These features provide insight into how brands can package their offerings so they are most appealing to customers. 

While COVID-19 has ushered in greater consumer awareness of PN solutions and even raised interest in subscribing to PN services, the uptick is not sufficient to create an aggressive growth trajectory for the sector. Although we believe that both awareness and interest will outlast the pandemic, PN providers still face ongoing challenges to broadening their customer base and significantly expanding adoption. Following are some guidelines to help players overcome obstacles and take advantage of current opportunities.

  • Double down on awareness. While the sector experienced a so-called COVID-19 bump, awareness of the PN category is still relatively low. Consider communications initiatives that underscore the importance of personalization for better health outcomes. 
  • Improve the price/value equation. Many consumers stated that they aren’t convinced that PN subscriptions are worth the price tag. But there are ways to raise the perceived worth of your service. Specifically, consider embedding features that consumers clearly value, including services like tailored recipes, eating plans and exercise guidance. If you can demonstrate tangible value, customers will be more willing to pay the price of personalization. 
  • Address privacy concerns. Fear about data privacy was a top deterrent to subscribing to a PN service. Make sure you can clearly demonstrate how you protect any consumer data shared with you for purposes of personalization, and feature these details prominently on your website. 
  • Create a feedback loop that will emphasize results/benefits. One of the challenges for the vitamins and supplements space in general is measuring outcomes. Unlike medications designed to target specific symptoms, PN regimens are often aimed at bettering overall health. Consider ways to demonstrate improved outcomes. An example in a related field, structured weight loss programs, is the weekly weigh-ins that demonstrate progress. 
  • Increase convenience/ease of use of your service. Keeping things simple will up the chances that more consumers will subscribe to your services. Most consumers find online quizzes a relatively simple way to provide customization information. Online quizzes were also vastly preferred over more invasive forms of testing to achieve personalization. 
  • Emphasize and solicit online reviews/testimonials. Consumers place great store in online reviews according to our research, and tend to value them even above healthcare provider recommendations. Make it easy for consumers to access product reviews, feature testimonials on your website, and encourage customers to post reviews of their own.
  • Establish strategic partnerships. Finally, forming alliances with certain organizations and related programs can help PN providers increase awareness of their services and expand distribution via existing member bases. Examples include direct-selling companies, structured weight management programs and fitness professionals.

To date, there are no clear leaders in the PN category, so now is the time to craft a winning strategy that will allow you to break away from the pack. 

Endnotes
1This number includes ~47% among 18-to-44-year-olds, 33% among 55-to-64-year-olds, 26% among those 65 and older
2”Some interest” is defined as a score of 4-7 out of 7
3 “High interest” is defined as a score of 6-7 out of 7
4”Some interest” included 90% of 18-to-24-year-olds, 87% of 25-to-34-year-olds and 91% of 35-to-44-year-olds

English
Executive Insights

Men’s Beauty and Personal Care Is Poised for Handsome Growth

November 24, 2021

Key takeaways

COVID-19 has served as a catalyst for men’s personal care with more men than ever before taking charge of shopping for their own personal care products.

Most men engaged in the category (especially men in higher-income households) prefer brands that target men.

Men’s skincare is a standout subcategory. Brands are responding to the opportunity with male-targeted and gender-neutral lines despite lingering cultural barriers to men’s beauty.

Cultural norms aside, authentic brands targeting men have a track record of success. In response, investment in quality brands is active, and incumbents and sponsors alike are on the lookout.

Men’s beauty and personal care (BPC) products are shedding their stigma. Basic hygiene and shaving products once marked the extent of the masculine grooming regimen. Today, men have a universe of options for skin, hair, beard and body. A proliferation of categories and brands, from mass to prestige, are targeting the male consumer as they tap a promising segment of the BPC market. Those that find the right formula are pulling ahead.

In this Executive Insights, we unpack some of the consumer purchasing trends and marketing strategies that are enabling men’s BPC products to capture significant growth and inch closer to the mainstream. We also look at a sample of companies that are taking the plunge into men’s cosmetics and then wrap with an exploration of growth and M&A trends in men’s personal care.

A signal of strength in men’s BPC products is that men are increasingly shopping for these items on their own. The recent pandemic has catalyzed this trend by giving men more disposable income, not to mention more time to participate in the purchase decision, browse for products and begin a routine. A recent L.E.K. Consulting survey of U.S. consumers reveals that COVID-19 conditions prompted 26% of all males to purchase their own personal care products instead of having a significant other or family member do it for them. Overall, there’s been a net increase of 17% of men now engaging actively in their personal care choices versus pre-pandemic levels (see Figure 1). 

Figure 1

Impact of COVID-19 on method of purchasing personal care products (2021)

Image
purchasing personal care products

Figure 1

Impact of COVID-19 on method of purchasing personal care products (2021)

Image
purchasing personal care products

For the men who are taking charge of their personal care choices, over 50% say they prefer brands like Harry’s, Jack Black and Dr. Squatch that specifically target men. By contrast, only 32% prefer brands that are gender neutral (such as Kiehl’s, C.O. Bigelow or SkinCeuticals), and just 16% favor female-oriented brands with a subline for men (e.g., Clinique for Men or Dove Men+Care). 

To break through the social conditioning that can make men hesitant to shop for personal care and beauty products, successful male-oriented brands place an emphasis on capturing opportunities to educate consumers and ease the purchasing process. Case in point: Dr. Squatch’s social media posts and YouTube infomercials, which humorously debunk the notion that men shouldn’t care about things like conditioner and effective shampoo routines. 

Overall, male consumers are becoming more active in searching for information online (see Figure 2), and successful brands are taking advantage.

Figure 2

Growth in online search traffic for men's skincare (2011-2021)

Image
growth in online search

Figure 2

Growth in online search traffic for men's skincare (2011-2021)

Image
growth in online search

Digital channels are the go-to platform for emerging male-centric brands for both education and conversion. The convenience of online shopping is seldom lost on male consumers, of course, but there’s also the benefit of creating a more private, hospitable environment to explore and find new products for personal grooming. According to L.E.K.’s own polling, COVID-19 accelerated the shift to ecommerce, with 56% of adult males in the U.S. indicating that they somewhat or significantly increased their online purchasing of personal care products in response to the pandemic (see Figure 3). 

Figure 3

Impact of COVID-19 on method of purchasing personal care products (2021)

Image
 method of purchasing personal care products

Figure 3

Impact of COVID-19 on method of purchasing personal care products (2021)

Image
 method of purchasing personal care products

Even so, 69% of male consumers say they continue to shop at brick-and-mortar locations as well (see Figure 4). Of the men’s BPC products sold in 2020, 79% were purchased in-store. That suggests there’s room for further growth, both in improving the in-store experience and in expanding assortment. 

Figure 4

Purchasing channel for personal care products

Image
Purchasing channel

Figure 4

Purchasing channel for personal care products

Image
Purchasing channel

One subcategory that stands out? Men’s skincare, which includes not only face washes, shaving creams and gels but also moisturizers, toners, sunscreen and face masks. In the U.S., men’s skincare grew roughly 8% a year — about double the growth in men’s BPC overall — between 2015 and 2019. After a dip during the COVID-19 outbreak, men’s skincare is expected to continue leading the market with growth of ~6% for each of the five years after 2020.  

There’s an unmistakable trend of quick, significant success emerging among unique, quality brands targeting men. Examples abound with tremendous growth in brands such as Harry’s and Dollar Shave Club contrasting with long-established brands like Irish Spring and Just for Men, which have seen stagnant sales over the past decade (see Figure 5). 

Figure 5

Sales of new and traditional men's personal care brands (2011-2020)

Image
new and traditional men's personal care brands

Figure 5

Sales of new and traditional men's personal care brands (2011-2020)

Image
new and traditional men's personal care brands

These newer brands also had the highest CAGR between 2015 and 2020, with Harry’s growing almost 50% during that time.

While the newer brands grew, some well-known, long-established brands such as Gillette and Schick saw a negative CAGR (see Figure 6).

Figure 6

Men's care market landscape (2015-2020)

Image
Men's care market

Figure 6

Men's care market landscape (2015-2020)

Image
Men's care market

In response to brands experiencing success, investment activity from financial sponsors and incumbent players alike has picked up as investors see opportunities to capture fast-growing brands in a category poised for growth (see Table 1). 

Notable deals in 2020 included Carlyle’s acquisition of men’s personal care company Every Man Jack and Edgewell’s $235 million purchase of Cremo. In 2021, deal activity has continued, with strong-performing brands like Duke Cannon Supply Co. and Dr. Squatch driving substantial market interest.

Table 1

Examples of recent transactions in men’s beauty and personal care

Image
recent transactions

Table 1

Examples of recent transactions in men’s beauty and personal care

Image
recent transactions

Looking forward, men’s BPC has tremendous white space available, and men’s skincare may be just the first step. As social norms evolve and stigmas disappear, emerging and established brands alike are pushing the envelope even further. Some, like Giorgio Armani and Brickell, are targeting men with skincare lines that include face wash, toner and moisturizer. Others are taking the trend further. Chanel introduced a male-oriented makeup line, Boy de Chanel, in 2018; telehealth startup Hims & Hers announced a partnership with baseball star Alex Rodriguez to launch a concealer for men; and emerging brands such as Stryx, War Paint and Alpha Male Cosmetics have come to market explicitly focused on makeup products for men. While men’s beauty and cosmetics have not yet crossed into the mainstream, we have seen early steps, and industry participants continue to push forward.

English

Transit Channel Strategy and the Cost of Fare Collection

November 24, 2021

Key takeaways

This Executive Insights explores contemporary considerations associated with unlocking further reductions in the cost of fare collection (COFC), specifically associated with channel management.

The article examines the ‘cost to serve’ across each of the available customer payment channels and the associated strategy to drive customer behaviour.

Consider how the procurement of second-generation (account-based) transit fare collection systems creates an imperative to carefully review customer channel strategy.

In a recent Executive Insights, Second-Generation Fare Collection Systems: The Current State of Play , we illustrated the progressive reduction in the cost of fare collection (COFC) tied to the evolution of transit payments (see Figure 1). One of the key considerations associated with minimising the COFC is understanding the ‘cost to serve’ across each of the available customer payment channels and the associated strategy to drive customer behaviour.

Figure 1

Evolution of Transit Cost of Fare Collection

Image
Transit cost

Figure 1

Evolution of Transit Cost of Fare Collection

Image
Transit cost

The early wins associated with channel management from a COFC perspective in a smart card world were relatively straightforward — remove high-cost payment channels such as rail station ticket booking offices and progressively remove or reduce ticket vending machines as customers migrated to smart cards and contactless payment. More recently, COVID-19 has provided the opportunity, in some cases, to do away with cash payment (e.g. on buses as a means of eliminating customer-driver interaction).

This paper explores contemporary considerations associated with unlocking further reductions in the COFC, specifically associated with channel management.

COVID-19 has accelerated the pace of cash’s decline faster than even the most bullish projections, with cash usage in 2020 broadly where it was expected to be in 2023. Cash was used for 20.5% of global point-of-sale transactions in 2020, a 32.1% reduction from 2019. This has enabled many transit operators to at least plan for the earlier-than-expected retirement of cash payment.

In August 2017, Singapore’s Land Transport Authority (LTA) announced its intention to eliminate all cash transactions by 2020. This coincided with the successful completion of the LTA’s account-based ticketing (ABT) trial and the associated roll-out of contactless payment channels. However, the LTA has yet to realise its objective of going cashless. Other transit authorities trialled the elimination of cash payment following the 2020 onset of the COVID-19 pandemic (e.g. many bus operators moved to cashless and rear-door boarding to eliminate close contact between passengers and bus operators).

From a transit agency perspective, the motivation to remove cash is clear — cash handling is costly, and operational benefits can be realised through faster bus boarding times, for example.

Despite the strong and accelerating global trend towards cashless payment, the challenge for transit agencies is that cash usage remains sticky for a relatively small group of customers, including some transport-disadvantaged groups that have a strong dependence on transit. It is important to recognise that this is about the strength of preference for cash payment amongst such customer groups and not about whether customers are unbanked. Across developed countries in the Asia-Pacific Economic Cooperation forum, the proportion of adults with an account at a financial institution ranged from 93% (United States) to 100% (Australia, Canada) in 2017.

The message here is clear: Despite the obvious benefits from an operational and COFC perspective, it will be important to move carefully with respect to any proposed total removal of cash payment, although the opportunity and demand to use cash on-system is likely to quickly decline in favour of other payment channels in the short to medium term.

The customer rationale for contactless payment has been very well documented.

From a transit agency perspective, however, the positioning of contactless payment has varied somewhat. For example, Transport for London has sought to aggressively drive contactless take-up at the expense of the Oyster transit smart card. In 2019-20, two-thirds of non-cash payments were made using contactless channels, with the balance made using Oyster. By way of contrast, Sydney also introduced a contactless payment channel alongside the Opal smart card but has positioned this as an additional payment channel to improve customer choice and convenience, alongside physical and digital versions of the Opal smart card. Some 31% of Opal adult trips are made using contactless, and 55% of these use a digital wallet.

While the introduction of new contactless payment channels has clearly unlocked customer convenience benefits, it also requires customers to ensure that they avoid ‘card clash’. This can occur when customers are carrying multiple physical cards in their purse or wallet (i.e. contactless debit or credit and bespoke transit cards). There are multiple issues associated with potential card clash:

  • Payment can be taken from a card other than the one intended by the customer
  • Customers could be charged two ‘default’ fares (i.e. one to the card used to validate system entry and one to validate system exit)
  • A fare might not be charged to a card, leaving the customer exposed to being considered a fare evader
  • A fare gate might not open

There are additional considerations for customers using contactless cards.

Firstly, a customer may be able to retrieve only a limited trip history (e.g. if they are using an unregistered contactless card). In Sydney, for example, a customer using contactless payments must register their card to obtain up to 18 months of trip activity. A customer with an unregistered card can only obtain details of the last 10 trips. In London it is possible to retrieve seven days of trip data for an unregistered card and a year of data for a registered card.

Secondly, closed (i.e. ‘touch in, touch out’) first-generation card-based systems provided customers with visibility on the fare paid on the card reader in real time when touching out of the system. The move to second-generation ABT systems has taken transaction processing — and the capacity to confirm the fare paid when touching out of the system — away from the reader, with processing of all contactless transactions now occurring more typically at end-of-day. However, there are examples emerging where transit agencies are developing system requirements that require real time transaction processing in an ABT environment.

It is debatable how important it is to be able to access payment history at or close to real time. Transit agencies around the world have sought to reassure customers with ‘best price’ guarantees for the full range of available fare products. In addition, trip history and associated payments can always be subsequently reviewed and queried with the transit agency if required.

At the time of the initial roll-out of contactless payment channels, there was a general expectation in some quarters that credit cards would continue to be the dominant card used for payment. However, a strong generational shift to debit has become increasingly apparent. As suggested by Visa’s chief financial officer, “Debit is clearly the gateway to cash digitization.”  In Australia, the market share of debit cards increased from 15% of transactions in 2007 to 44% in 2019.  In the 2021 March quarter, Visa saw 24% worldwide growth in debit volumes versus flat performance for credit, while Mastercard saw 27% growth in debit and a 1% decline in credit.

From a COFC perspective, the key issue here is the difference in merchant service fees between credit and debit card transactions. These fees are reflected in specific agreements between transit agencies and the financial institutions.

The functionality of a transit card changes from a chip with an e-purse holding funds, with the fare transaction processed at the card reader (first-generation ticketing), to a token with a primary role of providing an interface to a customer account held in the back office where the fare transaction is completed (second- or next-generation ABT environment).

Although the functionality of a transit card changes with the migration from first- to second-generation fare collection systems, there remains a strong rationale to retain a transit card. Even in those systems seeking to drive contactless payment as the primary payment channel, a significant proportion of adult customers will prefer to use a pre-paid transit card. The need for pre-paid options is even more obvious with respect to meeting the requirements of the concession market.

In terms of supporting other tokens in an ABT environment, there is a clear and strong case for supporting contactless payments (as described above) in accordance with EMV standards.1 Significantly, this means that the financial services sector is responsible for maintaining technical standards around transaction processing in a transit environment.

In contrast, should a transit agency choose to adopt other tokens supporting debit transactions in an ABT system — which could be any card or product with a chip, such as a driver’s licence, smartwatch, gym pass or university ID card — the onus falls on the transit agency to provide certification of the token against its own technical standards. This not only has cost implications for the transit agency but also could become very difficult from a customer management and communication perspective (e.g. student ID card from university X is supported as a transit token, but not the student ID card from university Y).

Although contactless payments have been introduced in many jurisdictions, this has not precluded ongoing investment in transit products. For example, Transport for NSW has been trialling an Opal digital card stored in a customer’s digital wallet.

The benefits of using a virtual card over a physical card are somewhat nuanced. Customers using their smartphone to browse the web or answer emails while completing a journey, for instance, will already have their virtual card in their hand. Similarly, some customers will enjoy the convenience of touching in and out of the system using a smartwatch rather than accessing a physical card from a wallet or purse.

From a customer perspective, it is important to avoid card clash issues with other digital or physical cards. Again, if multiple cards are stored in the digital wallet, then the transit card needs to be nominated as the default card. The same suite of issues identified above with respect to physical card clash apply.

With the proliferation of smartphones, mobile ticketing has emerged as an important customer payment channel in many jurisdictions. In 2021, an estimated eight in every 10 Australians used a smartphone. The progressive shutdown of the 3G network will further encourage the take-up of the latest generation of smartphones.

In many cases, mobile ticketing will clearly be part of the solution in terms of supporting the removal of cash on-system and supporting irregular customers without a physical contactless card. In some transit systems, mobile ticketing has been stood up as a replacement for paper tickets, with simple visual inspection; however, the migration to next-generation fare collection systems provides the opportunity to leverage barcodes and on-system optical readers for ticket validation.

As part of the transition to first-generation smart card systems and the associated withdrawal of on-system payment channels such as rail ticket booking offices, it was necessary to stand up significant retail networks with bespoke terminals supporting top-ups to the smart card e-purse. There will be an ongoing need in many systems to continue to support e-purse top-ups of transit cards and/or the purchase of other fare media where, for example, all on-system cash payment channels are removed.

Given the general imperative to maintain retail networks, it will be highly desirable for transit agencies to take the opportunity to leverage third-party devices as opposed to maintaining a network of bespoke transit-specific terminals. The need to provide bespoke retail devices inevitably saw transit agencies seek to limit the scale of the retail network to minimise both capital and operating costs. Solutions have emerged to address this issue. For example, an app is being developed as part of the Queensland ‘Smart Ticketing Project’ that can be downloaded to third-party terminals. Accordingly, there is no longer a need to artificially cap the number of retail outlets supporting transit payments as was the case with the first-generation solution.

It has now become commonplace in many retail settings for businesses to highlight and pass on the costs of using different payment channels. To date, transit agencies have generally tended to absorb these costs, hence creating a material differential between the market-facing (gross) fare and the net revenue received by the transit agency. In Australia, the Reserve Bank of Australia standard allows businesses to charge their customers a cost-based surcharge on card payments, but any surcharge is limited to the amount it costs the business to accept that type of card for that transaction.

It is interesting to note that, in some cases, transport authorities do apply and pass on cost-based surcharges (e.g. payment of motor vehicle registration). With the increasing significance of contactless payments and the convenience benefits afforded to customers, there could be a case for passing on these costs in the future. There is an interesting analogy here with toll road use, specifically the availability of a free alternative road offering lower amenity. In the transit payments space, this alternative could be the agency pre-paid transit card. The merits of this approach clearly depend on the relative cost to serve each channel.

Recent customer research conducted in New Zealand provided a range of valuable insights, particularly with respect to the transition from a first-generation card-based system to a second-generation system supporting contactless payments.

By way of context, it is worth noting that New Zealanders exhibit a strong preference for digital banking and contactless payments. Cash is the main/preferred method of payment for less than 10% of surveyed New Zealanders.

Only 6% of customers indicated a preference for continuing to use single-trip paper tickets. If the option to purchase a single-trip paper ticket were withdrawn, 76% of these customers indicated they would use a pre-paid transit card or a contactless debit/credit card. The remaining 24% indicated that they would stop using public transport altogether. In the New Zealand context, this 24% represents 3% of regular public transport customers.

The New Zealand research also highlighted the continued strong preference for using a pre-paid transit card. Nearly five in 10 customers (48%) expressed a preference for this payment channel, with around four in 10 customers (41%) expressing a preference for contactless debit/credit card payment.

The research also specifically provided some key insights into the capacity to drive take-up of contactless payments:

  • Just over one-third of customers are ‘ready to go’ (i.e. are familiar with and prefer contactless payment)

  • Another third will need some reassurance (i.e. are familiar with and prefer contactless payments but require reassurance around security/privacy and capacity to assess trip history)

  • Around 10% are ambivalent (i.e. do not have a contactless debit/credit card or smartphone but are open to using this payment channel)

  • The remaining 15% are characterised by a range of barriers to using contactless payments in public transport and will be difficult to engage (e.g. have security concerns/fears, perceive that credit cards are not for ‘everyday’ transactions, dislike using credit and lack familiarity/comfort with contactless payment generally)

The procurement of second-generation (account-based) transit fare collection systems creates an imperative to carefully review customer channel strategy. Specific channel issues that need to be addressed include:

  • The potential to go ‘cashless’
  • The merits of pursuing the aggressive take-up of contactless payments
  • The retention and positioning of the transit card (including the need for, and role of, a virtual transit card)
  • The case for supporting non-transit tokens for debit payment (other than EMV-supported debit transactions)
  • The role of mobile ticketing

At a broader strategic level, there are additional considerations such as:

  • Providing customers with transparency regarding merchant services fees and potentially passing these charges on to customers directly (i.e. over and above the fare paid)

  • Specifying the real-time processing of transactions to overcome one of the perceived losses of customer amenity associated with the migration to ABT processing (i.e. the inability to display the fare value when payment is made)

  • The breadth of channels offered and the positioning of each to support the realisation of transit agency objectives with respect to the overall COFC

English

In-Depth Analysis Pinpoints Growth Opportunities for Top Engineering Services Provider

December 6, 2021

Background and challenge

A global provider of advisory and engineering services to power, water and gas utilities had been successfully helping its customers with the following industry drivers and modernization challenges: 

  • Decarbonization, including an increased focus on lower greenhouse gas emissions generation and on increased system efficiency
     
  • Decentralization, including the need to accommodate micro-grids and individual, distributed power generation (e.g., residential solar energy generation)
     
  • Digitalization, including the modernization of systems and increased integration of various data streams via automated smart systems, such as smart meters
     
  • Reorganization, including the redesign of organizational structures to meet these challenges, especially with an aging workforce

The client enlisted L.E.K. Consulting to determine the drivers, size and growth outlook of the advisory and engineering services market. It also wanted to understand the landscape and current level of investment maturity in each of its target countries. We were also tasked with determining the most attractive service lines to prioritize, distilling the key points of the company’s value proposition to prospective buyers, and summarizing both the urgency of its challenges and the “right to win” it had been granted by its existing customers.

Approach and recommendations

We concluded that our client was well positioned to benefit from growth in the overall market, but was even better positioned to help its utilities customers navigate the digitalization process, capitalize on the development of smart cities and leverage the adoption of smart meters. Moreover, we recommended ways the company could prioritize for growth based on market maturity, and we validated its positioning for growth in new capabilities and technologies (e.g., micro-mobility, smart streetlights and smart waste management). Most importantly, we concluded that our client does not have a true direct competitor, as no other company offers a singular focus on the utilities sector along with a full range of services.

Results

Our in-depth assessment not only validated our client’s value proposition and characterized the level of need for its various market segments, but also validated its business plan, including opportunities for expansion, revenue growth potential and profitability. Our analysis also identified ways it could use its capabilities to solve the four main challenges facing utilities today, and provided it with a strategic plan, tailored by end market and geography, that takes into consideration each segment’s maturity, needs and expected growth. We submitted our findings in a final report to support the company’s growth strategy development and further support discussions with potential investors.

English

Major Train Network Technology Feasibility Study

November 22, 2021

Background and Challenge

A state government department was seeking to upgrade its Digital Train Radio System (DTRS), which was facing technological obsolescence and a corresponding reduction in vendor support.

The department had been approached with a proposal from a supplier but wanted to more broadly evaluate prospective systems given developments in technology and changes to the competitive landscape.

The department required assistance to understand the best way forward to deliver a new communications solution, whilst maintaining its existing DTRS system until implementation had been finalised. The solution needed to deliver global best practice outcomes for customers.

Approach and Recommendation

L.E.K. approached the project from the perspective of both capital planning and contract strategy, independently evaluating future technology options whilst being cognisant of the need to maintain the existing system. The support was provided through four modules, each building off the previous ones to ensure stakeholder buy-in and comfort.

Given the multiple stakeholders involved in the project and their differing concerns, module one involved a problem assessment in consultation with key stakeholders. This assessment evaluated the concerns, issues, and risks for the current DTRS system, future state requirements and capabilities needed to deliver required future functionality. This module concluded with stakeholder agreement on the problems that needed to be solved.

The second module developed options for the client to pursue. This involved a series of interviews, workshops, and research to identify and detail cases of global best practice, for comparison against existing options already being considered, including the option proposed by the incumbent vendor.

Image
digital train radio system criteria
Image
digital train radio system criteria

In the third module, L.E.K. worked with the client to shortlist and review three options for consideration. To do this, L.E.K. developed a balanced scorecard evaluation framework that included technological pre-requisites, client specific criteria and the risks associated with switching from the incumbent provider. The CapEx and OpEx costs associated with each option was also estimated through discussions with management.

Finally, a roadmap for change was developed through extensive consultation with relevant stakeholders to understand the steps required to implement the new system. This roadmap included a detailed transition plan and stakeholder matrix to ensure seamless service delivery while the new system was being implemented, including steps to appropriately maintain and operate the existing system should vendor support diminish.

Results

As a result of the four modules, the client received a collation of global best practice examples for DTRS solutions, evaluated using a balanced scorecard. This provided the foundation for selecting the best possible option for a new DTRS system. The client continued the process of implementing a new DTRS system using the implementation plan developed in module four as a guide to ensure a stable DTRS for the near future and a smooth transition to the new system.

English
Subscribe to