From Market to Innovation Hub

China's Role in Pharma
June 9, 2026


This video examines China’s evolving role in the global pharmaceutical industry, highlighting its transition from a major commercial market to a growing center of innovation, manufacturing, and strategic partnerships. It explores how government-led healthcare initiatives and continued investment in biopharmaceutical innovation are creating new opportunities for multinational companies seeking growth in China and across the broader Asia-Pacific region.

L.E.K. Consulting is a registered trademark of L.E.K. Consulting LLC. All other products and brands mentioned in this document are properties of their respective owners. © 2026 L.E.K. Consulting LLC 

English

Commercialization in APAC Pharma

From Operational Capability to Strategic Asset
June 9, 2026


This video explores the growing importance of commercialization platforms in the Asia-Pacific pharmaceutical market. It highlights how these platforms help biopharma companies navigate the region’s fragmented healthcare landscape by providing regulatory, market access, commercial, and operational capabilities across multiple markets. The discussion also examines increasing investor interest in commercialization platforms as scalable growth and value-creation vehicles.

L.E.K. Consulting is a registered trademark of L.E.K. Consulting LLC. All other products and brands mentioned in this document are properties of their respective owners. © 2026 L.E.K. Consulting LLC 

English

Commercial Excellence in Pharma Japan

The Key to Success
June 9, 2026


This video explores what commercial excellence means in Japan’s pharmaceutical market and why global strategies often require significant localization to succeed. It highlights the importance of deep KOL engagement, precision healthcare provider targeting, and omnichannel execution, while emphasizing that commercial agility and market-specific execution are critical drivers of product uptake, pricing success, and long-term brand performance.

L.E.K. Consulting is a registered trademark of L.E.K. Consulting LLC. All other products and brands mentioned in this document are properties of their respective owners. © 2026 L.E.K. Consulting LLC 

English

European Brand Owner Packaging Survey 2026: Sustainability — Balancing Circularity, Cost and Commercial Realities

Part 2 of a five-article series
June 8, 2026

After several years in which cost inflation, supply disruption and operational complexity dominated packaging discussions, sustainability is re-emerging as a central strategic priority for European brand owners. However, the way companies are approaching sustainability is changing.

Rather than pursuing sustainability as a standalone initiative, packaging teams are increasingly embedding it within broader decisions around packaging design, sourcing resilience, consumer usability and regulatory readiness. The result is a more pragmatic phase of sustainable packaging investment, one focused less on ambition alone and more on scalable execution.

L.E.K. Consulting’s European Brand Owner Packaging Survey 2026 highlights how sustainability priorities are evolving across the packaging value chain. The findings suggest that sustainable packaging is increasingly becoming a baseline expectation, while competitive advantage is shifting towards companies that can balance circularity goals with commercial and operational realities.

About the survey

L.E.K. Consulting’s European Brand Owner Packaging Survey 2026 is based on responses from approximately 400 brand owners across key European markets, including the UK, Germany, France and Spain. Respondents span major end markets such as food and beverage, healthcare, beauty and personal care, and consumer electronics.

The survey was conducted in December 2025 and January 2026 and captures brand owner perspectives on packaging demand, cost dynamics, sustainability and innovation priorities. As such, findings reflect market sentiment at the start of 2026

Sustainability is influencing packaging decisions more directly

The survey findings point to a notable shift in the drivers of packaging change. Desire to move to sustainable packaging is now the most-cited reason for changing primary packaging materials, selected by 43% of respondents, ahead of both transportation and material cost savings (see Figure 1). End-user and consumer preferences also rank highly at 38%, alongside practical packaging requirements such as shelf-life and product protection. 

Figure 1

 Drivers for change in primary brand packaging materials*

Image
Figure 1 Drivers for change in primary brand packaging materials*

Figure 1

 Drivers for change in primary brand packaging materials*

Image
Figure 1 Drivers for change in primary brand packaging materials*

This marks a meaningful evolution from the mid-2020s pattern, when sustainability ambitions were often constrained by high material costs, uneven regulation and limited availability of recycled-content materials.

The 2026 findings suggest that sustainability is increasingly being assessed through a broader operational lens. Packaging teams are evaluating tradeoffs across emissions, supplier practices, recycled-content availability, consumer usability and long-term compliance requirements, rather than focusing narrowly on recyclability claims alone.

At the same time, many companies have already captured the most accessible packaging cost efficiencies through lightweighting, redesign and supplier rationalisation over recent years. While cost discipline remains critical, sustainability is no longer being displaced as quickly by short-term cost pressures.

Sustainable packaging is becoming a broader redesign challenge

Looking ahead to 2030, the most commonly expected packaging change is an increase in the share of packaging that is sustainable, cited by 39% of respondents (see Figure 2). The next tier of expected changes centres on packaging format, opening functionality and pack-size adjustments.

Figure 2

Expected changes to primary SKU packaging by 2030*

Image
Figure 2 Expected changes to primary SKU packaging by 2030*

Figure 2

Expected changes to primary SKU packaging by 2030*

Image
Figure 2 Expected changes to primary SKU packaging by 2030*

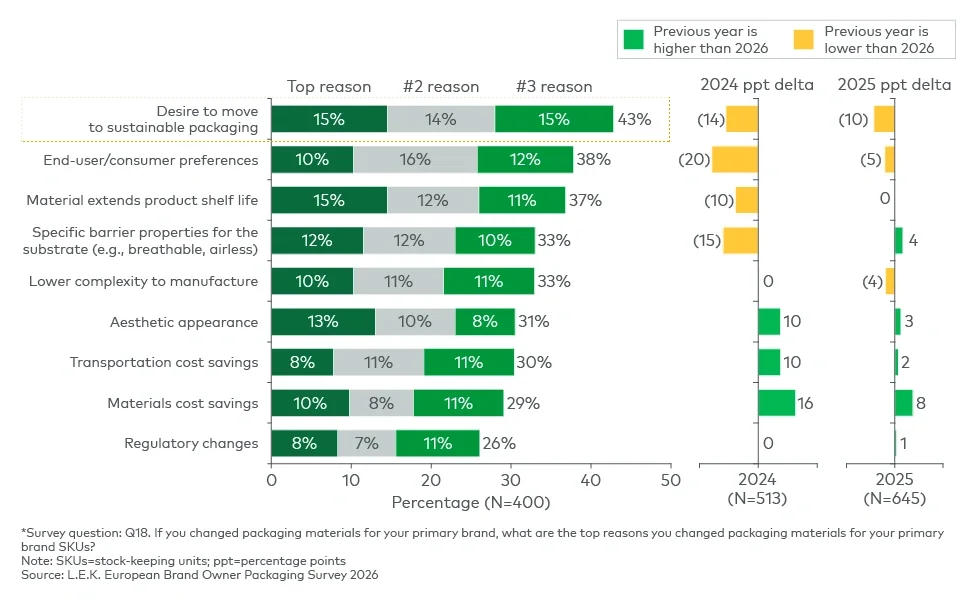
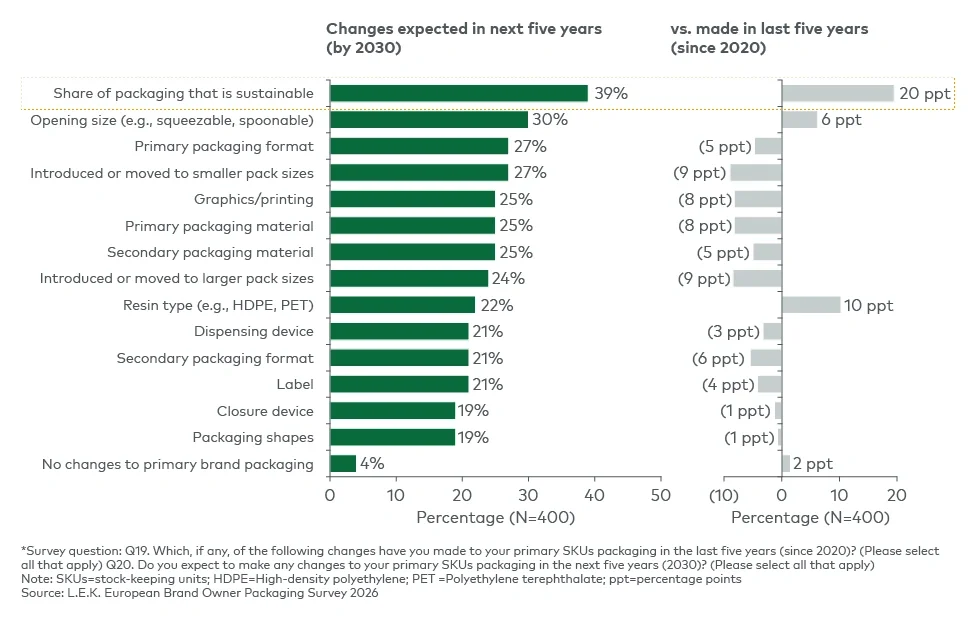
The findings suggest that sustainability is increasingly being implemented through wider packaging redesign rather than through isolated material substitution. Companies are using packaging changes to address multiple objectives simultaneously, including circularity, functionality, consumer experience and stock-keeping unit flexibility, reinforcing packaging's growing role as a platform for differentiation and portfolio agility.

Importantly, many of these decisions involve tradeoffs that packaging teams are still working through. Recyclable or mono-material formats can introduce higher costs or weaker barrier performance in certain applications, while innovative formats may prove difficult to scale consistently across large portfolios and multiple geographies.

As a result, the competitive advantage is increasingly rests with companies that can balance sustainability ambition with operational feasibility and commercial discipline.

Regulation is making execution the differentiator

Regulatory pressure is accelerating this transition, with sustainable packaging increasingly becoming a baseline expectation rather than a point of differentiation. Across Europe, measures such as the Packaging and Packaging Waste Regulation and recycled-content requirements under the Single-Use Plastics Directive are tightening expectations around recyclability, recycled content, packaging minimisation and labelling requirements.

However, the commercial implication extends beyond compliance alone. The challenge for brand owners is increasingly about execution capability: translating sustainability commitments into practical decisions across materials, suppliers, packaging formats and rollout sequencing while maintaining product performance and controlling costs.

The survey findings also suggest that sustainability expectations themselves are evolving. Brand owners increasingly define sustainable packaging not only through recyclability but also through broader system-level measures such as lower greenhouse gas emissions, renewable energy use and supplier environmental practices.

At the same time, economic constraints remain significant: 41% of respondents cite inability to absorb or pass through higher packaging costs as the main barrier to further sustainable packaging adoption. This tension between sustainability objectives and commercial realities is likely to remain a defining feature of packaging strategy over the coming years.

Three strategic priorities for packaging suppliers

The survey findings suggest that sustainability is no longer being addressed primarily through standalone packaging projects. Instead, it is becoming a broader redesign challenge that affects sourcing, pack architecture, compliance and consumer interaction simultaneously.

For packaging suppliers, three strategic priorities are emerging.

1. Scale circular-ready packaging without adding unnecessary complexity

As sustainable packaging becomes a baseline expectation, suppliers can differentiate by helping customers scale circular-ready solutions across portfolios without significantly increasing operational complexity.

This includes:

  • Simplifying structures and substrates where feasible without compromising product protection 
  • Supporting recyclable and mono-material designs that remain commercially viable at scale 
  • Developing packaging solutions that can adapt to evolving reuse and refill requirements where economically practical

The challenge is increasingly about repeatability and manufacturability, not simply innovation in isolation.

2. Secure access to sustainable materials and resilient supply chains

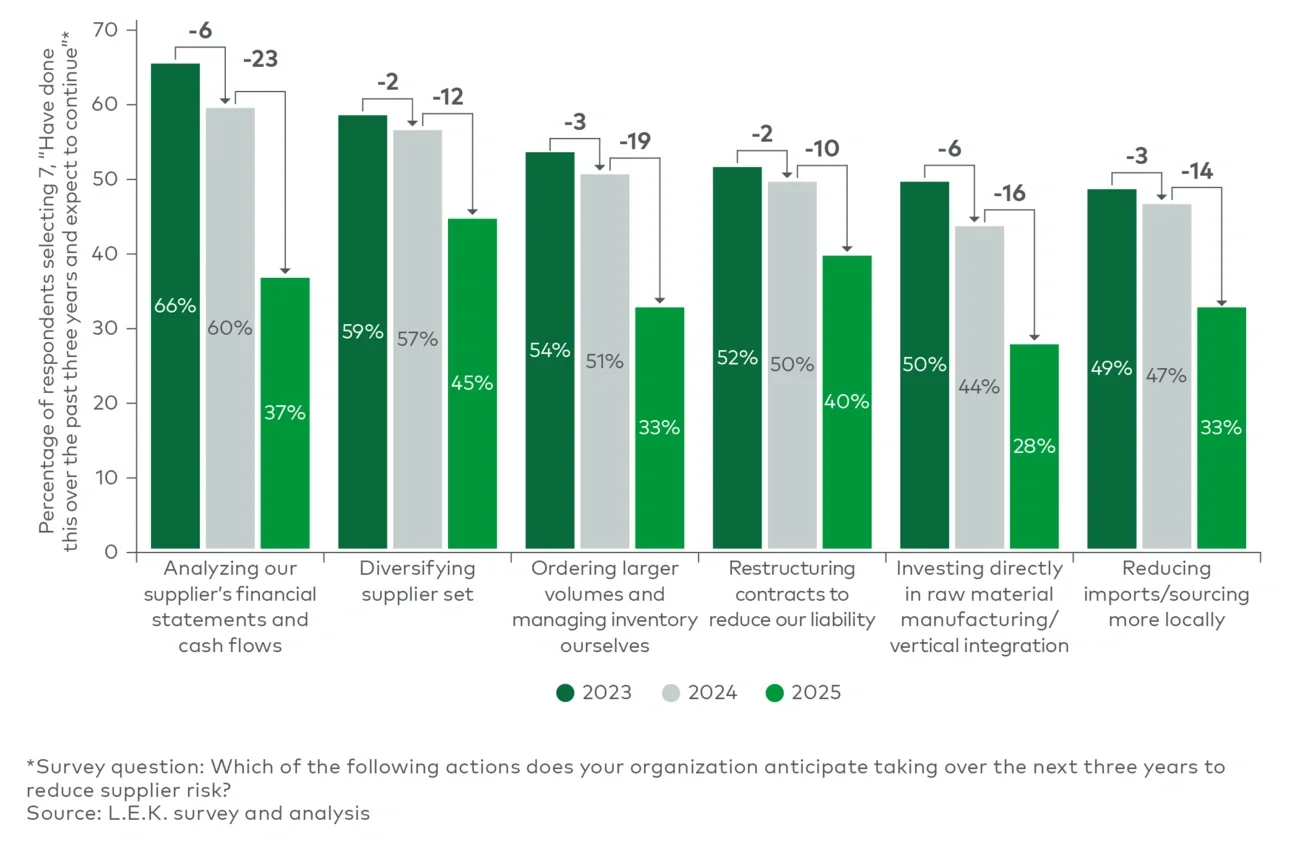
Although sustainability has regained strategic momentum, supply security and cost management remain critical concerns for brand owners.

Suppliers that can secure reliable access to recycled and alternative materials, manage supply volatility and demonstrate credible emissions progress are likely to strengthen their competitive position.

Key priorities include:

  • Expanding qualification pathways for alternative resins and fibre grades 
  • Building stronger recycled-feedstock partnerships and sourcing models 
  • Improving transparency around emissions, renewable energy sourcing and material traceability

As sustainability requirements tighten, material availability and compliance credibility are increasingly becoming sources of competitive differentiation.

3. Make sustainability commercially visible to consumers

The survey findings suggest sustainability gains greater traction when paired with tangible improvements in usability and consumer experience.

Packaging suppliers can support this by helping brands:

  • Improve openability and dispensing convenience while maintaining material efficiency 
  • Introduce right-sized formats that reduce excess packaging 
  • Simplify disposal and recycling guidance through clearer labelling and pack communication 
  • Strengthen substantiation and traceability to reduce greenwashing risk

For many brands, sustainability is becoming most effective when consumers can see and experience the benefit directly, rather than encountering it only through marketing claims.

Sustainability is becoming an execution challenge, not just an ambition

European brand owners are increasingly moving beyond sustainability commitments to implementation at scale. Over the next several years, competitive advantage is likely to depend less on headline sustainability targets and more on the ability to execute consistently across sourcing, design, compliance and consumer experience.

For packaging suppliers, the opportunity increasingly lies in helping customers scale sustainable packaging solutions that are operationally viable, commercially credible and compliant by design.

This article follows the first article in the series, which examined the return of selective growth across the European packaging market. In the next article, we explore how US tariffs and trade uncertainty are reshaping packaging sourcing, supplier strategies and regional manufacturing footprints across Europe.

To discuss how these sustainability trends apply to your business, please contact us.

L.E.K. Consulting is a registered trademark of L.E.K. Consulting. All other products and brands mentioned in this document are properties of their respective owners. © 2026 L.E.K. Consulting

English
Executive Insights

Systemic Lupus Erythematosus Real-World Evidence: Patient Treatment Dynamics and Implications for Biopharma R&D

June 8, 2026

Key takeaways

The complex, heterogeneous nature of systemic lupus erythematosus (SLE) often results in early misdiagnosis and diverse comorbidity profiles, complicating treatment as well as drug development efforts.

An analysis of approximately 270,000 SLE patients in the Komodo Healthcare Map® claims database indicates that over half receive alternative diagnoses during their journey, and nearly all face comorbidities over their lifetime, with patterns varying by gender.

Monotherapy with either a DMARD/immunosuppressant or biologic remains the common treatment approach in SLE, but as the disease progresses, an increasing number of patients are treated with combination therapies using both drug types.

Use of this real-world data provides insights on specific patient profiles and treatment journey trends that should be leveraged to better develop differentiated trials and launch plans that align with current treatment gaps and patient unmet needs, particularly in a crowded R&D pipeline with over 40 Phase II+ assets.

SLE disease complexity

Systemic lupus erythematosus (SLE) is a complex multisystem immune condition where a patient’s immune system becomes dysregulated and produces autoantibodies, leading to widespread inflammation and innate immune activity. The impact of the disease is profound, with the vast majority of patients developing complex symptomatology and facing reduced life expectancy.

Diagnosing and treating SLE continues to present substantial challenges due to its unpredictable natural history and broad range of clinical manifestations. Symptoms can vary drastically between patients — ranging from joint pain and fatigue to severe organ failure. Symptoms often overlap with other diseases as well. Along with current limitations in diagnostic tests, disease mischaracterization can delay diagnosis and lead to varied patient management and suboptimal care. Today, it can take almost six years between initial SLE symptom onset and formal diagnosis. On top of the difficulty with diagnosis, the disease’s heterogeneity also means no single treatment plan will fit all patients, and therapeutic effectiveness may vary greatly based on disease severity and comorbidities. If untreated or managed incorrectly (including delayed treatment), SLE patients can experience organ failure, such as kidney failure (commonly beginning as lupus nephritis) and heart failure.

Utilization of real-world data — such as healthcare claims — can provide greater clarity on current SLE management practices across diverse patient groups and provide SLE-focused drug manufacturers with a set of data-driven outputs that can support strategic planning. Ultimately, better characterization of treatment dynamics enables manufacturers to align their strategies with unmet needs in a way that enhances both patient outcomes and commercial success.

Patient natural history, SLE diagnosis and comorbidity presence

Recent SLE patient diagnosis and treatment dynamics were evaluated through the Komodo Healthcare Map® claims database from 2016 to 2024. To evaluate the differential diagnosis dynamics among SLE patients, a cohort of SLE patients from the Komodo dataset was defined as individuals who had multiple SLE claims at least four years apart (i.e., patients with a higher likelihood of “true’’ SLE diagnosis). This identified roughly 270,000 unique individuals, with a 9:1 distribution of women to men. Approximately 30% of these SLE patients were identified as having a misdiagnosed illness at some point during their SLE diagnosis journey. Almost half of these misdiagnoses were for common diseases with overlapping SLE symptoms.

Both autoimmune diseases and non-autoimmune diseases with prominent SLE symptom overlap were identified as the most frequent misdiagnoses claims codes in the SLE patient cohort (see Figure 1). Overlapping symptoms such as joint pain, dry mouth and fatigue appear to contribute to misdiagnosis. In select cases, these overlapping symptoms can be indicative of a combined manifestation of both diseases (e.g., secondary manifestation of Raynaud’s syndrome in SLE patients).

The range of possible misdiagnoses likely contributes to the longer diagnostic journey and treatment mismanagement commonly experienced by SLE patients, as healthcare providers must decipher and treat symptoms without being able to determine the underlying cause. In cases such as fibromyalgia and fatigue, treatment options may vary drastically from what is prescribed to SLE patients — as healthcare providers focus on treating the pain and fatigue instead of the underlying inflammation. In autoimmune misdiagnosis situations, there may be overlap in initial nonspecific immunosuppressant treatments (e.g., disease-modifying anti-rheumatic drugs (DMARDs)) but no overlap in more specific treatment options targeting the underlying biology of SLE.

Figure 1

Alternative diagnoses associated with SLE patients

Image
Figure 1 Alternative diagnoses associated with SLE patients

Figure 1

Alternative diagnoses associated with SLE patients

Image
Figure 1 Alternative diagnoses associated with SLE patients

SLE is further complicated by the range of nonimmune comorbidities and organ failures that can appear over time, with comorbidities such as pain, hypertension and infections commonly beginning earlier in a patient’s SLE journey. The top comorbidities among SLE patients were identified based on claims (see Table 1), with approximately 3 in 4 SLE patients having a chance of the highest occurring comorbidity and 1 in 5 SLE patients having a chance of the lowest occurring comorbidity. The distribution of comorbidities was also different between women and men. Additionally, almost all comorbidities occurred at a higher rate in SLE patients relative to the general population.

Table 1

Top SLE comorbidity occurrences

Image
Table 1 Top SLE comorbidity occurrences

Table 1

Top SLE comorbidity occurrences

Image
Table 1 Top SLE comorbidity occurrences

Men with SLE primarily show increased rates of hypertension, heart conditions and kidney conditions. In parallel, women with SLE primarily show pain and mental health (e.g., depression) comorbidities (see Figure 2). This comorbidity burden in SLE can muddle treatment plans as healthcare providers evaluate polypharmacy approaches to treat individuals.

Figure 2

SLE patients by comorbidity, women vs. men

Image
Figure 2 SLE patients by comorbidity, women vs. men

Figure 2

SLE patients by comorbidity, women vs. men

Image
Figure 2 SLE patients by comorbidity, women vs. men

Differential drug treatment trends among SLE patients

Treatment of SLE is managed with both nonspecified therapies like corticosteroids and DMARDs/immunosuppressants and specified, targeted biologics Benlysta and Saphnelo (the only approved biologic treatments). Patients are normally started on nonspecified therapies (potentially prediagnosis) before moving to targeted biologics, depending on disease severity. However, given the wide immunosuppression caused by treatments like DMARDs, targeted therapies are increasing in use as newer generations are developed to suppress only SLE-related immune activity. For example, within the first half of this decade (2021-24), the rate of on-label biologic use substantially increased compared to other treatment options. Over a five-year period following an SLE diagnosis, use of biologic monotherapies increased roughly four times in patients. In parallel, DMARD/immunosuppressant use grew only slightly over the past four years, while corticosteroid use and rituximab (off label) remained relatively stagnant (see Figure 3).

Figure 3

SLE drug dynamics (2021-24)

Image
Figure 3 SLE drug dynamics (2021-24)

Figure 3

SLE drug dynamics (2021-24)

Image
Figure 3 SLE drug dynamics (2021-24)

Monotherapy drug strategies continue to remain the most utilized approach to treating SLE by total claims volume. DMARD/immunosuppressant use is the primary treatment plan at initial diagnosis and during the years following (around 50% of tracked patients use DMARD/ immunosuppressant monotherapies across a five-year period). Biologic adoption commonly occurs in the years following SLE diagnosis and following patient use of a standard (DMARDs/ immunosuppressants, corticosteroids) SLE treatment regimen, aligning with Food and Drug Administration labels and drug utilization plans. In more recent years, patients who progress are increasingly using DMARDs/immunosuppressants and biologics in combination rather than just as monotherapies. Unlike DMARDs/immunosuppressants and biologics, corticosteroid usage, which was higher in early years following diagnosis, was reduced by half within the first three years after diagnosis in line with the need to taper steroid use to limit longer-term side effects (see Figure 4).

Figure 4

SLE drug use following 2020 SLE diagnosis

Image
Figure 4 SLE drug use following 2020 SLE diagnosis

Figure 4

SLE drug use following 2020 SLE diagnosis

Image
Figure 4 SLE drug use following 2020 SLE diagnosis

Implications for treating SLE and beyond

Today’s SLE R&D pipeline is comprised of over 100 assets, of which roughly 40 assets are in Phase II or further. Key mechanisms in development include APRIL/BAFF inhibitors (approved in China), B cell targets (e.g., CD20, CD19), kinase inhibitors (TYK2, JAK1) and interferon targets (e.g., IFN gamma, BDCA2). Beyond replacing or augmenting the standard of care, novel therapies may be able to achieve earlier adoption in the patient journey through novel precision medicine strategies or by clearing current clinical thresholds. While these treatments will further the tool kit, the real-world evidence analyzed here suggests that additional investment in better SLE diagnostics and precision medicine strategies will be imperative to limit the elongated diagnosis timeline and better characterize SLE in a heterogeneous patient population.

For organizations looking to market more targeted treatments for SLE, it will be imperative to invest in strategies that align with the different patient comorbidities (e.g., early hypertension presentation, susceptibility to infections) and appropriately design trials with primary and surrogate endpoints that validate the use of a novel asset over or in combination with approved therapies in SLE patient populations. For commercialization, organizations must also both optimize pricing models that best reflect the specific benefits being delivered to patients and implement customer-facing field strategies that ensure the right patients find the right treatments given diverse symptoms and treatment journeys. The implications of the data shown here are relevant for not just SLE but also other autoimmune diseases (e.g., rheumatoid arthritis) and other complex diseases (e.g., neurodegeneration) with high patient heterogeneity, diverse patient journeys and varying treatment plans or lines of therapy.

L.E.K. Consulting can help R&D and commercial organizations assess complex patient and disease dynamics to inform strategic planning, including:

  • Evaluating a patient journey and discovering nuances that may exist to drive different subpopulations that may require different treatment support
  • Characterizing disease progression to develop a more complete picture of disease complexity and heterogeneity to better understand downstream implications on treatment dynamics, informing clinical development strategies
  • Identifying areas where organizations could improve customer-facing efforts to drive greater treatment adoption, treatment adherence, patient support opportunities and patient outcomes

All real-world claims data was provided by the Komodo Healthcare Map®. The Komodo Healthcare Map® is a database of de-identified real-world patient data representing the individual healthcare experiences of more than 330 million de-identified U.S. patients.

For more information, please contact us.

L.E.K. Consulting is a registered trademark of L.E.K. Consulting LLC. All other products and brands mentioned in this document are properties of their respective owners. © 2026 L.E.K. Consulting LLC

English

AI in Clinical Development

Trends & Strategic Implications
June 1, 2026


This video explores how AI is increasingly transforming clinical development within the biopharma industry. It highlights current applications in clinical trial data analysis, monitoring, and medical writing, while also examining emerging opportunities and challenges in areas such as patient recruitment and site selection. The discussion emphasizes the importance of AI strategy, ecosystem partnerships, and data readiness for biopharma companies, biotech firms, and CROs. 

L.E.K. Consulting is a registered trademark of L.E.K. Consulting LLC. All other products and brands mentioned in this document are properties of their respective owners. © 2026 L.E.K. Consulting LLC 

English
Executive Insights

When Does a CDMO Roll-Up Become a Platform?

A framework for investor decision-making in consumer health and beauty
June 1, 2026

Key takeaways

Platform valuation premiums are driven by observable operating capabilities rather than scale alone, with cross-site commercial integration as the clearest differentiator

Cross-selling is the most reliable indicator of platform economics. L.E.K. Consulting benchmarks indicate best-in-class cross-site revenue can reach 25% in Europe-only platforms and 50% in cross-continent platforms, though most achieve materially less

Structural advantages can support a base-case valuation, while execution-dependent levers should be treated as conditional upside

Operational maturity, particularly data visibility, integration discipline and central control, determines whether value creation can be realised

Platform economics are earned, not assumed

In consumer health and beauty, the distinction between a collection of manufacturing assets and a fully functioning contract development and manufacturing organisation (CDMO) platform is a primary determinant of value. Investors may value asset collections at 8–12x EBITDA multiples, while fully integrated platforms can command 15–20x EBITDA multiples or more. The gap reflects more than perception. It reflects differences in operating model, commercial integration and the ability to generate repeatable value

A platform is not defined by the number of sites it owns. It is defined by its ability to route customers, data and capabilities across those sites through a coordinated commercial and operational infrastructure. By contrast, a portfolio aggregates assets under common ownership but leaves them largely independent.

The practical question for investors is therefore straightforward: can the business operate as a single system rather than a collection of parts? The answer determines whether platform economics are real and whether valuation premiums are justified.

The platform test: Commercial integration, visibility and control

A CDMO platform combines local specialist capabilities with a centralised operating spine. This distinction is particularly important in consumer health and beauty, where customer fragmentation, stock-keeping unit complexity and speed-to-market requirements are higher than in traditional pharmaceutical outsourcing.

Three conditions determine whether a platform model is functioning effectively.

First, commercial integration must enable customers to buy across formats through a single relationship. Where sales teams remain siloed by site, cross-selling remains aspirational rather than embedded in the operating model. Evidence of multi-site customers and increasing wallet share is therefore a critical indicator of platform maturity.

Second, the central team must have sufficient visibility into performance to manage the business actively. This includes timely and granular insight into margins, utilisation, working capital and pipeline. Without this, scale introduces complexity without sufficient control.

Third, the platform must capture economic benefits from scale without weakening local responsiveness. In this sector, customer intimacy and technical agility are often decisive. Over-centralisation can undermine both, limiting the very advantages the platform is intended to create.

Failure in any one of these dimensions typically prevents platform economics from fully materialising.

Four engines of value creation

Our analysis identifies four primary engines through which CDMO platforms create value: commercial growth, structural resilience, margin expansion and repeatable M&A (see Figure 1).

Figure 1

Four Engines of CDMO Platform Value Creation

Image
Figure 1: Four Engines of CDMO Platform Value Creation

Figure 1

Four Engines of CDMO Platform Value Creation

Image
Figure 1: Four Engines of CDMO Platform Value Creation

Commercial growth is driven by cross-selling, key-account expansion and increased customer wallet share across formats. Structural resilience arises from diversification across customers, geographies and capabilities, reducing dependency on individual sites or segments. Margin expansion reflects procurement leverage, improved utilisation and shared infrastructure. Repeatable M&A enables systematic sourcing and integration of acquisitions, supported by standardised playbooks.

This framework provides a more precise lens than do generic buy-and-build narratives, particularly when assessing sustainability of returns.

Structural advantages versus execution-dependent levers

Not all value drivers carry equal certainty. A critical distinction exists between structural advantages embedded in the platform design and execution-dependent levers that require sustained operational delivery (see Figure 2).

Figure 2

Structural Advantages vs Execution-Dependent Value Levers

Image
Figure 2: Structural Advantages vs Execution-Dependent Value Levers

Figure 2

Structural Advantages vs Execution-Dependent Value Levers

Image
Figure 2: Structural Advantages vs Execution-Dependent Value Levers

Structural advantages include multi-format breadth, specialist depth at site level, customer and geographic diversification, and shared quality or data infrastructure. These characteristics can typically be observed and supported through diligence.

Execution-dependent levers include cross-sell penetration; procurement harmonisation; sales, inventory and operations planning integration; central key-account management; and post-merger integration discipline. These are contingent on management capability and organisational maturity.

The implication for investors is direct. Structural advantages can support base-case assumptions, while execution levers should be probability-weighted and discounted appropriately.

Empirical buy-and-build evidence reinforces this distinction. Published private equity (PE) performance research covering more than 2,000 transactions found that deals deepening into a core industry generated an average internal rate of return of c.44%, versus c.16% for diversification plays. Experience compounds, but scale does not guarantee returns. Industry research on healthcare PE similarly describes platform tuck-in strategies as proven value creation tools, with investors increasingly adopting a barbell approach: targeting either premium scaled assets with clear differentiation or sub-scale platforms where operational improvement drives growth.

Where platform value is proven and where it remains theoretical

A disciplined investment approach requires distinguishing between different tiers of value creation evidence.

Proven value is observable in current operations. This includes existing cross-site revenue, measurable utilisation headroom and demonstrated ability to transfer production across sites. The most reliable indicator is the trajectory of multi-site revenue as a share of total revenue, rather than any absolute threshold.

Near-term realisable value typically lies in procurement and overhead efficiencies. Industry benchmarks suggest that centralised procurement can deliver 7%-10% savings on direct spend, alongside margin uplift within a relatively short time frame. However, these outcomes depend on standardised specifications, aligned quality systems and supplier consolidation — conditions that are not universally present.

Theoretical upside includes full cross-sell potential, format mix optimisation and geographic expansion. While these are credible sources of value, they depend on sustained execution over multiple years and should not be underwritten on the same basis as proven economics.

For investors, distinguishing between these tiers is essential to maintaining valuation discipline and protecting downside risk.

Operational maturity determines investability

Platform value is ultimately determined by operational maturity rather than scale. The most effective diligence approach combines market sizing and competitive mapping with a structured assessment of how the platform operates in practice.

Key performance indicators provide a practical test of maturity (see Figure 3).

Figure 3

Operational KPIs for Assessing Platform Maturity

Image
Figure 3: Operational KPIs for Assessing Platform Maturity

Figure 3

Operational KPIs for Assessing Platform Maturity

Image
Figure 3: Operational KPIs for Assessing Platform Maturity

These include multi-site revenue share, customer retention by vintage, quote-to-order conversion rates, line utilisation, production transfer speed, procurement savings realised versus planned, integration speed across enterprise resource planning and customer relationship management systems, and founder retention stability.

Each key performance indicator tests a specific dimension of platform functionality. For example, multi-site revenue share indicates whether customers are engaging with the platform as a network rather than individual sites, while transfer speed reveals whether capacity can be flexed efficiently across the system.

Where management cannot provide these metrics consistently and at sufficient granularity, platform maturity is typically overstated.

Our maturity assessment framework evaluates seven dimensions: cross-selling effectiveness, business-as-usual operational capability, integration governance and playbook quality, targeted performance support from the centre, procurement optimisation, M&A screening sophistication, and M&A competitiveness with founders.

Scaling constraints emerge as platforms grow

As CDMO platforms expand beyond the initial phase of acquisitions, structural constraints begin to emerge.

Cost pressure from lower-cost regions becomes increasingly relevant, particularly where competitors in Asia or Eastern Europe can offer structurally lower production costs. Maintaining competitiveness requires targeted investment in technology and capabilities rather than cost-based competition.

At the same time, central visibility becomes more difficult to maintain. Operating models that function effectively with a limited number of sites often struggle as complexity increases. Scaling requires investment in systems, data infrastructure and central resources to preserve control.

Finally, acquisition selectivity tends to decline as the pool of attractive targets narrows. This increases the risk of pursuing suboptimal transactions to sustain growth. Strong integration discipline, supported by a repeatable playbook with defined milestones and governance, becomes critical in mitigating this risk.

For investors, the implication is clear: beyond the first wave of acquisitions, integration quality is a more important determinant of value than acquisition volume.

Implications for diligence and underwriting

Effective diligence should focus on verifying platform economics through observable evidence.

  • Prove platform economics with observable data. Confirm the existence and growth of multi-site customers, analyse cross-sell performance by acquisition cohort, review the extent of shared systems adoption and assess how effectively the central team intervenes in underperforming areas. If these cannot be produced, the platform story is incomplete.
  • Separate realised value from underwritten upside. Existing revenue synergies and utilisation improvements should carry higher conviction than future procurement savings or mix benefits. Underwrite each category at different discount rates.
  • Assess operational bottlenecks at line level, not group average. Bottlenecks in quality assurance, labour or scheduling are often masked at the group level but can materially affect performance. Site visits and line-level data are non-negotiable.
  • Test governance and integration under stress. The robustness of integration processes, clarity of decision rights and ability to manage founder transitions are more predictive of future outcomes than are acquisition pipelines.
  • Reward focused depth and penalise adjacent sprawl. In fragmented consumer health manufacturing, disciplined expansion in the core tends to outperform breadth pursued for narrative value alone.

Platform value depends on operating system, not scale

The central question for investors is not whether outsourcing demand in consumer health and beauty will continue to grow. The structural tailwinds are well established. The more important question is whether a given platform has built the operating system required to capture that growth.

Valuation premiums should be reserved for businesses that demonstrate three capabilities: repeatable customer routing across sites, supported by growing multi-site revenue; central operational control, evidenced by timely visibility and intervention; and disciplined M&A execution, enabled by standardised integration processes.

Where these conditions are met, the platform model is credible and the value creation pathway is clear. Where they are not, the business remains a portfolio, regardless of scale.

Investors should therefore prioritise platform maturity assessment as a core diligence workstream, supported by rigorous analysis and bottom-up operational validation.

Contact us for a discussion on how these insights apply to your portfolio or a specific opportunity.

L.E.K. Consulting is a registered trademark of L.E.K. Consulting. All other products and brands mentioned in this document are properties of their respective owners. © 2026 L.E.K. Consulting

English
Executive Insights

The CEO Agenda for the ‘New’ Payments Enterprise

May 29, 2026

Key takeaways

The payments industry is undergoing structural change as real-time money, embedded ecosystems, agentic commerce, trust monetization and regulatory shifts reshape how value is created and scaled. Emerging 2026 pressure points are accelerating the need for enterprise-wide transformation.

As AI agents increasingly influence commerce and payments decisions, competitive advantage will shift toward providers that are easiest to integrate with, trusted by default and able to deliver reliable performance at scale.

Embedded ecosystems and real-time infrastructure are redefining growth and distribution economics, pushing firms to simplify partner enablement, standardize integration and balance speed with control.

Trust is becoming a monetizable growth lever, with firms increasingly packaging fraud, identity and compliance capabilities as differentiated services while navigating rising operational and regulatory complexity.

The payments industry is entering a period of structural change in which multiple forces are reshaping economics, distribution and operating models. The foundations of how money moves, how value is created and how risk is managed are being rearchitected simultaneously. Intelligent and agentic commerce is reshaping discovery, conversion and operations as software is increasingly mediating decisions that were once made by humans. Embedded ecosystems are reorganizing how financial products are distributed and consumed. Real-time and programmable money are compressing cash cycles and altering segment-level economics. Trust is evolving from a control function into a potentially differentiated, monetizable layer. And legal and regulatory shifts are increasingly reshaping the economic boundaries of the system.

What makes this moment distinctive is not the presence of these forces individually, but the way they interact. Decisions made in one domain increasingly constrain or amplify options in others. As a result, payments strategy is becoming less about optimizing isolated initiatives and more about designing an enterprise that can adapt, scale and compete across interconnected shifts.

Payments leaders are increasingly turning their attention from simply improving their organizations toward architecting enterprises capable of expanding into new segments, scaling through partners, monetizing trust, and operating with reliability and control at real-time speed. Doing so requires a clearer view of where strategic pressure is building and where uncertainty is highest.

This anchor publication from L.E.K. Consulting introduces the CEO Strategy Matrix, a framework designed to help executive teams navigate this complexity. The matrix surfaces where core strategic imperatives intersect with structural market forces and where unresolved questions are emerging that demand chief executive officer (CEO)-level attention.

The paper does not attempt to provide a single definitive answer across the matrix — as with any thoughtful strategy, the path each firm chooses to navigate the matrix will be unique to its own point of departure and capabilities. Instead, we lay out the landscape and explore a set of intersections where we see growing strategic tension and leadership uncertainty. These areas will be the focus of continued research and follow-on analysis in the months ahead as we test how firms are responding and where competitive advantage is beginning to form.

Introducing the CEO Strategy Matrix

We built the CEO Strategy Matrix as a way to translate broad market forces into an actionable executive agenda. The matrix explores the intersection of five market forces and four strategic imperatives to highlight where CEO-level trade-offs are concentrating. Each intersection represents a distinct set of strategic questions. At any given moment, only a subset of intersections will exert meaningful pressure on leadership teams, and these priorities will vary by business model, geography and starting position.

In this anchor paper, we highlight five of the intersections where early signals point to the greatest opportunity for durable advantage and the most consequential strategic choices facing CEOs’ teams today. These sections are intended to frame the questions, tensions and enterprise design considerations that CEOs and their leadership teams are beginning to confront. They also establish the agenda for subsequent research, which will deepen the analysis and surface clearer points of view as evidence emerges.

Image
CEO Strategy Matrix

Note: AI=artificial intelligence; SaaS=software as a service; API=application programming interface 
Source: L.E.K. research and analysis 

Image
CEO Strategy Matrix

Note: AI=artificial intelligence; SaaS=software as a service; API=application programming interface 
Source: L.E.K. research and analysis 

The 2026 pressure points

1. Redesigning money: Real-time and programmable liquidity as a growth engine

Intersection: New money × The next billion

Real-time and programmable money are often framed as faster payment rails. In practice, they may be far more disruptive. By compressing settlement cycles and enabling conditional movement of funds, these capabilities have the potential to change which segments can be served profitably and how value is captured. For CEOs, the open question is where these innovations fundamentally alter economics. Faster settlement reduces float but improves liquidity. Programmability enables new use cases but introduces operational and control complexity. The net impact will likely vary widely by segment, geography and business model.

Many firms are piloting real-time capabilities, but few have translated them into repeatable segment-level strategies. The risk is investing in infrastructure without clarity on where it creates durable advantage.

Emerging CEO questions:

  • Which segments or use cases become viable only with real-time or programmable money?
  • How do compressed cash cycles change unit economics, pricing and risk allocation?
  • Where does programmability unlock new revenue versus creating operational burden?
  • What operating capabilities are required to deliver reliability at real-time speed?

2. Competing in an agentic commerce economy

Intersection: Intelligent and agentic commerce × (The next billion + Charting channels)

Artificial intelligence (AI) is beginning to alter how payments products are discovered, selected and operated. Automation is spreading across onboarding, routing, risk, dispute management and customer service, while agents increasingly mediate decisions that were once made by humans. For payments leaders, this raises a fundamental question: How does competition change when agents, not people, become the decision-makers?

Early signals suggest that agentic commerce may reshape both growth and go-to-market advantage. Automation has the potential to make previously uneconomic segments viable by reducing friction and cost to serve. At the same time, agent-mediated discovery could shift distribution power toward providers that are easiest for machines to integrate with, evaluate and reliably select.

What remains unresolved is how quickly these dynamics will materialize and what it will take to compete effectively when performance signals, integration depth and reliability matter as much as brand or sales coverage. Many firms are experimenting, but few have clarity on where automation truly expands access versus where it simply reallocates value.

Emerging CEO questions:

  • Where can automation meaningfully expand the addressable market, rather than just improve efficiency?
  • How might agent-mediated selection change what distribution advantage means in payments?
  • What signals (performance, reliability, economics) will matter most when agents choose providers?
  • How should firms test whether AI-driven capabilities are creating growth, not just lowering cost?

Market signal call-out: Agent-driven commerce is on track to reach about 9% of U.S. digital commerce by 2029.

3. Productizing trust: Turning risk, identity and compliance into growth

Intersection: Monetization of trust × The next billion

Trust has long been treated as a defensive requirement in payments — necessary to operate, but rarely a source of differentiation. That assumption is being challenged. As fraud, identity and compliance demands rise, customers and partners are increasingly willing to pay for higher assurance, lower friction and better outcomes. This shift raises a strategic question: Can trust move from an internal control function to a monetizable product layer and, if so, under what conditions?

Some firms are beginning to package elements of their trust stack as embeddable services. Others are experimenting with tiered assurance models tied to pricing, conversion or approval rates. Yet there is little consensus on what customers will pay for, how trust should be bundled or how monetization affects adoption and retention.

Emerging CEO questions:

  • Which trust capabilities create measurable customer value with clear willingness to pay?
  • How should trust be packaged (stand-alone, bundled or embedded) to maximize adoption?
  • What outcomes can credibly support pricing and differentiation?
  • How can firms build a unified trust stack that scales across products and partners?

Market signal call-out: Klarna’s Merchant Protection Program now guarantees merchants the full purchase amount on eligible transactions, effectively packaging fraud and dispute protection as a bundled trust layer within its payments offering.

4. Orchestrating embedded scale: Building partner enablement that launches faster

Intersection: Embedded ecosystems × Postmodern tech and data

Embedded finance is no longer constrained by demand. Merchants, platforms and software as a service (SaaS) providers increasingly expect financial capabilities to be delivered within their workflows. As embedded ecosystems scale, payments firms are discovering that partner enablement, not product breadth, is the bottleneck. Time to launch, integration friction and inconsistent implementations often erode economics and customer experience.

The unresolved challenge is how to industrialize embedded distribution without sacrificing flexibility. Firms must balance standardization with partner differentiation, speed with control and scale with reliability.

Emerging CEO questions:

  • What partner enablement capabilities truly matter to win embedded distribution (integration, implementation, operations, support)?
  • What capabilities must be standardized to enable partners to launch quickly and repeatably?
  • Where does customization create real value versus unnecessary complexity?
  • How should reliability, controls and experience standards be enforced across partners?

Market signal call-out: “The next phase of embedded finance will be defined less by who offers the most products and more by who can build a repeatable enablement layer for partner scale. As ecosystems grow more complex, the differentiator becomes the ability to combine speed, reliability, compliance, and intelligent infrastructure into an experience that allows partners to launch quickly without recreating operational friction each time. The banks that win will standardize the foundational enablement layer while preserving flexibility where it truly differentiates the partner and customer experience.”

-Whitney Woyke, EVP of Retail & Embedded Banking, Emprise Bank

5. Owning the embedded channel mix: Where to play, how to bundle, how to scale

Intersection: Embedded ecosystems × Charting channels  

As embedded finance expands, payments leaders face a more complex channel landscape. Direct merchants, vertical SaaS, horizontal platforms, marketplaces and ecosystem partners each offer different economics, control points and scalability profiles.

The strategic question is where does embedded distribution create sustainable advantage? Treating every opportunity as strategic risks spreading resources thin and accumulating complexity faster than growth. At the same time, bundling decisions (what products to offer, how to price them and how partners participate in value creation) are becoming more consequential.  

Emerging CEO questions:  

  • Which embedded channels offer true scalability versus near-term volume?
  • How should product bundles differ by channel to balance adoption, economics and speed?
  • What partner roles and incentives support repeatable growth?
  • How can firms expand embedded distribution while avoiding channel conflict? 

Market signal call-out: "The winners in the embedded landscape will be those who can orchestrate multi-party value chains without diluting their unit economics through over-customization. Success requires a 'distribution-first' architecture that allows for flexible bundling at the edge while maintaining a standardized, lean core for global scale."

-Kevin Fox, CRO, Thredd

Conclusion

The payments enterprise is being reshaped across multiple dimensions at once. None of these forces operate in isolation — each amplifies the others, creating new opportunities as well as new constraints.

The CEO Strategy Matrix is designed to help leaders see this system holistically. It does not prescribe a single path forward; instead, it provides a structured way to identify where strategic pressure is building, where uncertainty is highest and where enterprise design decisions will matter most.

The intersections explored in this anchor paper reflect areas where executive attention is increasingly required, but not yet settled. In the months ahead, we will deepen the analysis across these intersections, test emerging hypotheses and surface clearer points of view as evidence develops.

L.E.K. Consulting is a registered trademark of L.E.K. Consulting LLC. All other products and brands mentioned in this document are properties of their respective owners. © 2026 L.E.K. Consulting LLC

English

Four Trends Shaping US Specialty Chemicals in 2026

May 29, 2026

Key takeaways

U.S. specialty chemicals companies entered 2026 in a more disciplined operating environment, with differentiated products supporting resilience despite uneven demand and margin pressure.

Supply chain and distribution strategies are becoming more targeted, and companies are prioritizing reliability, tariff risk management and technically capable regional partners.

Sustainability investment is shifting toward initiatives with measurable returns, while safety concerns and reformulation remain ongoing requirements driven by customer expectations.

Digital adoption is accelerating as labor constraints intensify, pushing companies to focus on productivity, efficiency and execution against core strategic priorities.

U.S. specialty chemicals companies entered 2026 facing a more disciplined and selective operating environment. Against a backdrop of uneven volume growth and margin pressure in the broader chemical market, specialty players remain comparatively resilient due to differentiated products and exposure to higher-value end markets. At the same time, specialty chemicals firms are navigating four important trends:

  1. Persistent supply chain complexity
  2. Evolving sustainability and safety considerations
  3. Ongoing digital transformation
  4. Rising labor constraints

In this edition of L.E.K. Consulting’s Executive Insights, we take a closer look at each of these trends and how they’re influencing specialty chemicals executives’ strategic priorities and investments. Along the way, we highlight quantitative findings from our latest U.S. Specialty Chemicals Executive Survey to provide a clearer picture of where the industry stands as companies position themselves for the next phase of growth.

1. Supply chain and distribution strategies are becoming more targeted

Supply chain stability remains a central focus for specialty chemicals companies as they refine their strategies following several years of pressure. While supply and demand have largely rebalanced across chemicals supply chains, executives remain focused on shoring up reliability and mitigating risk.

Many companies have acted to reduce supplier risk in recent years. Now that supply chains have normalized somewhat, chemical industry executives are taking fewer mitigation measures. This shift reflects the distinction between measures taken during periods of heightened disruption and the needs companies prioritize in a more stable environment (see Figure 1).

Figure 1

Chemical manufacturer organization continuation of supplier risk mitigation actions (2023, 2024, 2025)

Image
Figure 1 Chemical manufacturer organization continuation of supplier risk mitigation actions (2023, 2024, 2025)

Figure 1

Chemical manufacturer organization continuation of supplier risk mitigation actions (2023, 2024, 2025)

Image
Figure 1 Chemical manufacturer organization continuation of supplier risk mitigation actions (2023, 2024, 2025)

Trade policy is another factor shaping supply chain decisions. Distributors report broader and more persistent tariff-related disruptions than do manufacturers. These disruptions show up in several areas that include sourcing difficulty, changes in product availability, delivery delays, competitiveness pressures and impacts on customer demand. Survey responses highlight how tariff exposure varies across the value chain and how downstream players often experience these effects more directly.

Distribution strategy is evolving as a result. Manufacturers show a stronger preference for end-market-specific distributors and regional partners, while broadline distributors receive less emphasis. The survey indicates that companies value distribution relationships that offer technical knowledge, formulation support and local insight that align with the needs of their customers (see Figure 2).

Figure 2

Specialty chemicals manufacturers’ channel shifts, by company revenue (2025)

Image
Figure 2 Specialty chemicals manufacturers’ channel shifts, by company revenue (2025)

Figure 2

Specialty chemicals manufacturers’ channel shifts, by company revenue (2025)

Image
Figure 2 Specialty chemicals manufacturers’ channel shifts, by company revenue (2025)

Together, these findings show an industry adjusting its supply chain approach with greater focus and clarity. Companies continue to strengthen resilience, elevate technical support in distribution and refine the actions that will help create more predictable and customer-aligned supply networks moving forward.

2. Sustainability investment is becoming more selective, while safety stays nonnegotiable

Sustainability remains an important area of focus for specialty chemicals companies. However, it’s becoming more pointed, as survey respondents reveal. Instead of broad increases, companies expect to concentrate spending on initiatives with clear operational or cost benefits. These include waste handling, renewable energy and supplier engagement (see Figure 3).

Figure 3

Specialty chemicals firms’ expected change in investment in sustainability (2022-25, 2025-28F)

Image
Figure 3 Specialty chemicals firms’ expected change in investment in sustainability (2022-25, 2025-28F)

Figure 3

Specialty chemicals firms’ expected change in investment in sustainability (2022-25, 2025-28F)

Image
Figure 3 Specialty chemicals firms’ expected change in investment in sustainability (2022-25, 2025-28F)

Safety considerations also continue to shape decisions on where to invest. Executives report high levels of customer concern across multiple substance types, such as pesticides, microplastics and bisphenol A. These concerns reflect a strong focus on chemical composition and health-related attributes in customer discussions.

Reformulation activity aligns with these expectations. Roughly half of companies report that they have reformulated or phased out products containing chemicals of concern over the past three years. A similar share expect to continue these efforts in the next three years. Reformulation is becoming a consistent part of product strategy rather than an isolated response.

At the same time, the perceived importance of sustainability investment has decreased compared with 2025 across all company sizes. The largest and smallest firms show the most notable declines. This shift indicates that while sustainability remains relevant, companies are assessing how these investments contribute to competitiveness and long-term performance (see Figure 4).

Figure 4

Importance of sustainability investment, by company size (2025)

Image
Figure 4 Importance of sustainability investment, by company size (2025)

Figure 4

Importance of sustainability investment, by company size (2025)

Image
Figure 4 Importance of sustainability investment, by company size (2025)

Overall, sustainability remains important, though it was less often ranked as a top strategic priority as in 2024. Companies are focusing on areas that deliver measurable results while maintaining attention to safety and customer expectations. Together, these shifts illustrate a more deliberate and outcome-focused approach to sustainability across the specialty chemicals sector.

3. Digital transformation is accelerating and moving toward value creation

Digital transformation continues to gain traction across the specialty chemicals sector, and survey results show how rapidly this shift is taking hold. Companies are moving from experimenting with individual tools to integrating digital capabilities across more parts of the organization. As businesses look for ways to improve efficiency, strengthen decision-making and enhance customer engagement, digital adoption is becoming more of a practical lever rather than an aspirational goal.

One of the clearest signs of this momentum is the rise in tool usage since 2022. Executives report significant increases in the adoption of artificial intelligence (AI), machine learning, generative AI and lead generation software. These technologies support a wide range of applications that include forecasting, automation, marketing outreach and data-driven planning. The expansion reflects not only the growing availability of tools but also stronger organizational readiness to put them to work in everyday processes (see Figure 5).

Figure 5

Usage of digital tools among chemical companies, past and present (2022, 2025)

Image
Figure 5 Usage of digital tools among chemical companies, past and present (2022, 2025)

Figure 5

Usage of digital tools among chemical companies, past and present (2022, 2025)

Image
Figure 5 Usage of digital tools among chemical companies, past and present (2022, 2025)

While adoption is increasing across the board, progress isn’t uniform. Smaller companies report stronger movement toward achieving their digital goals than do larger firms. The survey indicates that smaller organizations show higher levels of progress across areas such as digital channels, improved customer interactions and operational efficiency. This difference may stem from the agility and shorter decision cycles common in smaller organizations, which can make it easier to roll out new tools or refine existing systems (see Figure 6).

Figure 6

Chemical company digital tool progress toward achieving goal, by company size (2025)

Image
Figure 6 Chemical company digital tool progress toward achieving goal, by company size (2025)

Figure 6

Chemical company digital tool progress toward achieving goal, by company size (2025)

Image
Figure 6 Chemical company digital tool progress toward achieving goal, by company size (2025)

Digital progress is also shaping how companies think about future priorities. Many firms are shifting their focus from building foundational systems to applying digital capabilities in ways that create measurable value. For example, stronger use of analytics helps teams refine planning processes, while automated workflows can improve speed and reduce variability in routine tasks. These types of improvements support goals that include efficiency, reliability and better customer experience.

In addition, digital investments appear to be influencing how companies coordinate across functions. As tools evolve, teams are using shared data more consistently, which enhances collaboration between commercial, operational and customer-facing groups. This growing alignment supports clearer decision-making and helps companies move toward more streamlined processes.

The survey doesn’t suggest that digital transformation is complete, but it does show steady progress. Companies are building on foundations set in recent years and increasingly applying digital capabilities to support both near-term goals and longer-term performance.

4. Labor pressures are reemerging as a major constraint

Labor concerns are resurfacing across the specialty chemicals sector. After a period of easing challenges, companies now report rising difficulty in attracting and retaining qualified talent. According to the survey, 75% of chemical industry executives express high concern about labor availability, especially in manufacturing and supply chain roles (see Figure 7).

Figure 7

Degree of labor supply concerns among chemical companies (2025)

Image
Figure 7 Degree of labor supply concerns among chemical companies (2025)

Figure 7

Degree of labor supply concerns among chemical companies (2025)

Image
Figure 7 Degree of labor supply concerns among chemical companies (2025)

These concerns extend into areas such as operational continuity, cost efficiency and production planning. The need for skilled workers who understand complex processes and safety requirements makes hiring more difficult, particularly for roles that require technical depth or hands-on production expertise.

As companies adjust to these pressures, many are expanding initiatives that support talent acquisition and retention. These include training programs (76% of respondents), clearer career pathways and strengthened internal capabilities. Although the survey doesn’t prescribe specific solutions, responses suggest that firms view workforce stability as essential to meeting operational goals.

Labor availability will remain an important factor as companies manage growth plans, maintain service levels and respond to shifting demand. The renewed emphasis on talent mirrors broader industry priorities that tie organizational performance directly to the capabilities of the workforce.

Adopting a more deliberate operating posture

So how will executives respond to these trends? The priorities that guided decision-making in 2025 offer a clear signal of where organizations are headed. In our survey, chemical industry executives rank profitability, operational efficiency and top-line growth as having been their most important strategic areas. These themes shaped much of the work across the sector in 2025 and remain closely tied to operational and market conditions (see Figure 8).

Figure 8

Importance of strategic initiatives among chemical companies (2025)

Image
Figure 8 Importance of strategic initiatives among chemical companies (2025)

Figure 8

Importance of strategic initiatives among chemical companies (2025)

Image
Figure 8 Importance of strategic initiatives among chemical companies (2025)

Profitability held the top position for many companies. This focus aligns with the continued effort to manage costs and streamline operations in an environment where pressures on performance remain present. Operational efficiency also played a central role. Companies invested in strengthening internal processes that support reliability, consistency and margin stability. Top-line growth rounded out the leading priorities, with companies looking to drive commercial performance through more targeted actions.

The initiatives companies leaned on show how these priorities translated into daily execution. Targeting new customers (66% of respondents) was one of the most common ways companies pursued growth. Building workforce capability also played an important part, with many organizations emphasizing training and upskilling to support both efficiency and customer engagement. Recurring revenue models gained attention as well, offering companies a steadier base for planning and performance (see Figure 9).

Figure 9

Chemical company initiatives’ importance in addressing top priorities

Image
Figure 9 Chemical company initiatives’ importance in addressing top priorities

Figure 9

Chemical company initiatives’ importance in addressing top priorities

Image
Figure 9 Chemical company initiatives’ importance in addressing top priorities

Together, these initiatives demonstrate how companies approached their 2025 goals with practical, measurable actions. Rather than spreading efforts across many areas, companies concentrated on the levers that connect most directly to their strategic objectives.

The focus areas established in 2025 create a foundation on which companies can continue to build. The survey doesn’t identify new forward trends, but the patterns already in motion help explain how companies are positioning themselves for what comes next. The emphasis on profitability, efficiency and customer-focused growth remains aligned with the broader issues specialty chemicals companies are working to navigate.

This edition of Executives Insights includes updates from a previously published article.

For more information, please contact us.

L.E.K. Consulting is a registered trademark of L.E.K. Consulting LLC. All other products and brands mentioned in this document are properties of their respective owners. © 2026 L.E.K. Consulting LLC

English
Subscribe to