Executive Insights

How AI Is Reshaping Advertising

April 23, 2026

Key takeaways

Artificial intelligence (AI) is compressing the consumer journey from multistep funnels into fewer, faster interactions, increasing zero-click behavior, reducing measurable touchpoints and shifting brand visibility from search rankings to algorithmic curation.

Performance transparency is becoming increasingly important as advertisers demand closed-loop attribution and demonstrable return on investment (ROI), raising the bar for channels that cannot clearly demonstrate impact.

Commerce, content and community are converging inside platforms, with discovery and transaction happening without external site visits, fundamentally changing where advertising spend flows.

Ad spend is reallocating across the ecosystem: Channels with strong first-party data, effective targeting, contextual relevance or direct conversion capabilities gain share, while legacy models dependent on high-volume traffic face structural decline.

The advertising industry is facing its most fundamental shift since the rise of digital media. Generative AI has fundamentally changed content economics. What was once expensive and time-consuming to produce can now be generated at scale in seconds. Content scarcity, which has shaped advertising strategy for decades, has been replaced by content abundance.

AI tools such as ChatGPT are also becoming the first stop for product discovery: Over 4 in 10 U.S. adults say they are likely to use an AI tool to research potential purchases. This is pulling traffic away from the open web and search, putting search engine marketing (SEM) spend under immediate pressure. Nearly 30% of marketers already report decreased search traffic as consumers turn to AI tools.

Even as AI disrupts traditional discovery channels, social commerce and influencer marketing have built something it cannot replicate: a direct path from trusted recommendation to purchase. 58% of consumers have made a purchase because of an influencer endorsement, and U.S. influencer spend is on track to reach $13.7 billion by 2027.

AI is collapsing the consumer journey

Before AI, the online customer journey followed a predictable path: Consumers discovered products, considered options, decided what to buy and took action. Advertisers paid for each interaction along the way.

AI interfaces compress that sequence. Every purchase stage, from initial awareness to final checkout, shifts from high-friction browsing to high-velocity prompting (see Figure 1). The funnel that advertisers relied on to structure campaigns and measure performance is shrinking into fewer, faster and more opaque moments.

Figure 1

The AI-accelerated purchase journey

Image
Figure 1 represents the AI-accelerated purchase journey

Figure 1

The AI-accelerated purchase journey

Image
Figure 1 represents the AI-accelerated purchase journey

For advertisers, this creates a visibility problem. As consumers stay inside AI-generated responses instead of clicking through in zero-click interactions, attribution breaks and key touchpoints disappear. Brands need to show up directly in AI-generated answers, recommendations and product comparisons, instead of relying on search rankings or display ads.

Measurement shifts from impressions to outcomes

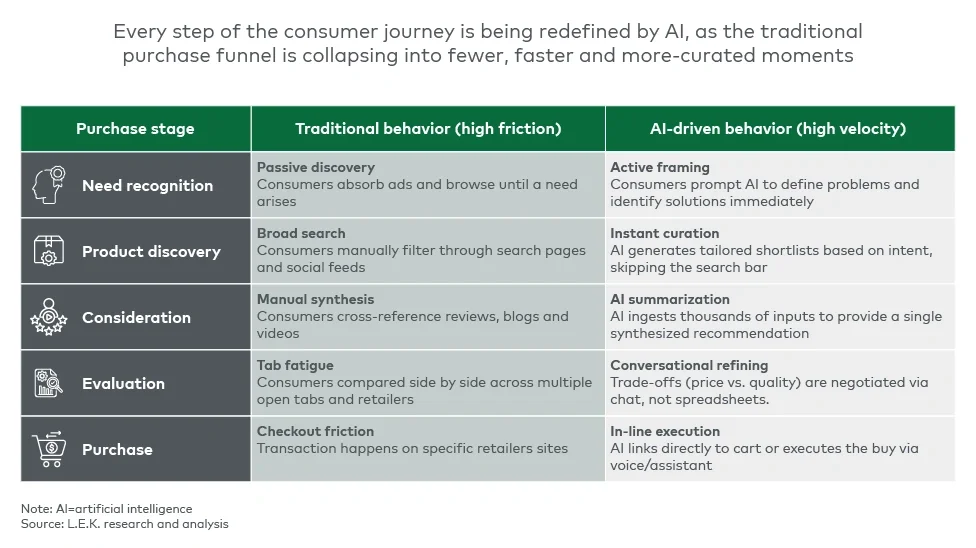
Performance-based advertising has already been gaining ground as marketers prioritize measurable outcomes over reach. AI accelerates this shift by compressing the consumer journey into fewer, platform-contained interactions, leaving less signal to measure and optimize.

Advertisers now expect platforms and partners to prove impact, not just deliver reach. Sales or ROI is now the most commonly cited measure of marketing success, raising that expectation further.

This raises the bar across the ecosystem. Channels that cannot tie spend to conversion face cuts, and intermediaries that generate volume without proving incrementality get deprioritized.

Content, commerce and community converge

The boundaries between media, creators and transactions are dissolving. Consumers increasingly discover and buy products without leaving social or video platforms, as TikTok, Instagram and YouTube offer native commerce layers that turn influencers into storefronts and communities into purchasing engines.

In 2025, 45% of U.S. TikTok users purchased directly within the platform, where conversion rates can reach 8%-12% versus roughly 2%-4% for traditional ecommerce.

This convergence redirects advertising spend toward platforms that can integrate discovery, engagement and checkout within a single experience. Creators who drive direct conversion command premium rates, while brands that still route consumers to external websites face friction that their competitors avoid.

Spend and power reallocated across the ecosystem

As AI reshapes discovery and attribution, every stakeholder in the advertising value chain faces pressure to adapt. The implications vary by position:

Advertisers

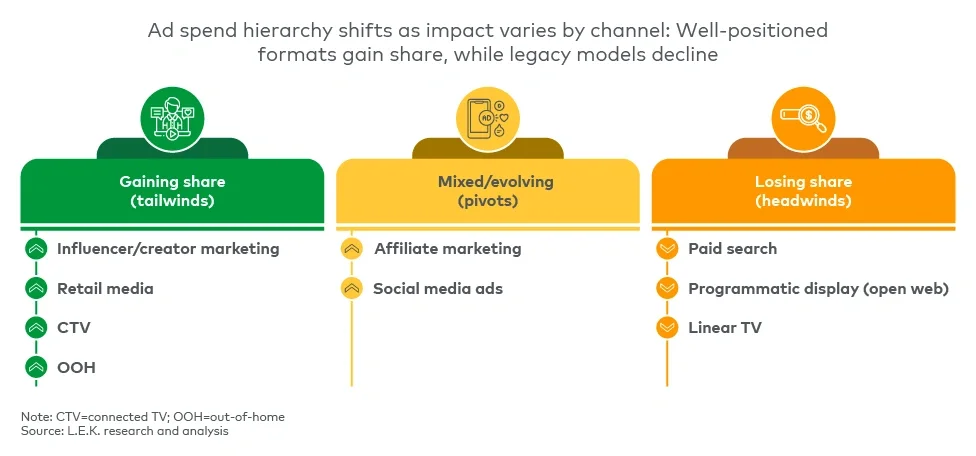
Brand visibility will increasingly depend on appearing in AI-generated recommendations, requiring structured product data, platform integrations and investment in generative engine optimization (GEO), alongside traditional search engine optimization (SEO). Advertisers will reallocate spend away from SEM, where AI-driven discovery is reducing click-through volume, toward platforms and formats with direct conversion potential. Budget decisions will sharpen around customer acquisition cost, lifetime value and incrementality.

Platforms and inventory owners

Search and content-driven platforms face pressure as consumers rely on AI-generated summaries instead of clicking through. While remaining traffic may be higher intent, it may not compensate for the decline in overall volume. Platforms must adapt as inventory that cannot tie to outcomes faces deprioritization and pricing pressure.

Intermediaries and affiliates

Traditional SEO and arbitrage-driven models are structurally disadvantaged as AI reduces reliance on click-driven discovery. In contrast, models built on trusted recommendations and direct conversion, particularly influencer and creator-led commerce, are more resilient, with 60% of consumers trusting what a creator says about a brand more than the brand itself. The gap is widening between models that can tie spend to outcomes and those that cannot.

Direction of travel for advertising models

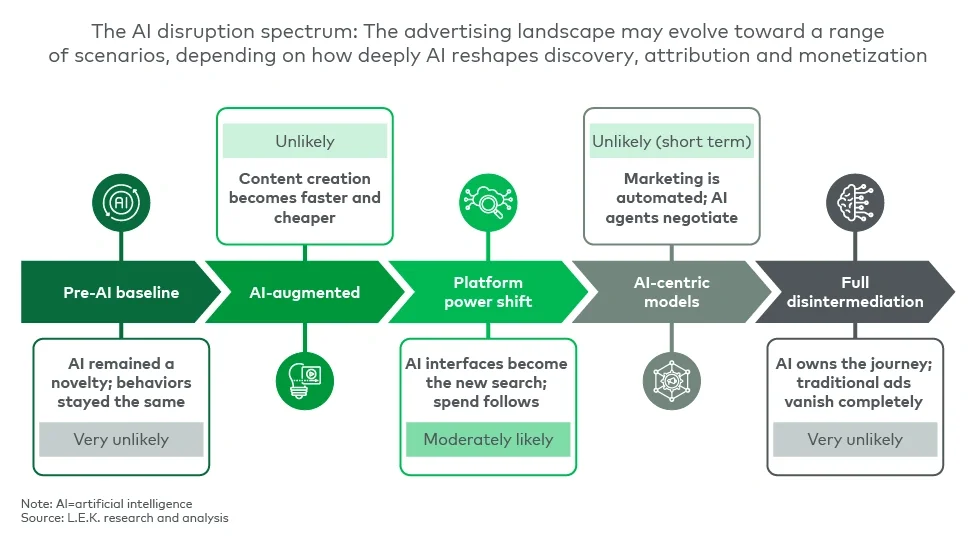
AI introduces varying degrees of disruption. The most extreme scenarios, where traditional ad models collapse entirely or marketing becomes fully automated and AI-driven, remain unlikely in the near term (see Figure 2). But moderate disruption is already underway.

Figure 2

Five scenarios for AI's impact on advertising

Image
Figure 2 represents five scenarios for AI's impact on advertising

Figure 2

Five scenarios for AI's impact on advertising

Image
Figure 2 represents five scenarios for AI's impact on advertising

Power is shifting toward platforms that control both discovery and conversion. Channels that lose visibility or fail to demonstrate performance will see spend reallocated. Winners will be those that control high-intent discovery or direct conversion and can clearly demonstrate their impact.

Example: Travel planning in the AI era

To understand the impact, consider how a consumer books a family trip to Tokyo.

  • The Old Way (Search and Scroll): The user searches “family-friendly hotels Tokyo.” They browse 10 blue links, click through to TripAdvisor, read a travel blog and visit Expedia. Along the way, they generate impressions for display ads and click data for multiple intermediaries.
  • The AI Way (Prompt and Answer): The user prompts an AI agent: “Plan a 5-day trip to Tokyo for a family of 4 under $400/night.” The AI agent analyzes the options and returns a single curated recommendation: “I suggest the Mimaru Tokyo Ueno North. It fits your budget and has apartment-style rooms.” The user clicks directly to the hotel site and completes the booking.

Implication: The hotel wins the booking not because it bought a banner ad or ranked first in SEO but because it invested in making its data accessible and legible to AI systems through structured content, integrations and GEO. The intermediaries (the travel blog, the search engine, the aggregator) are bypassed entirely, losing both the traffic and the attribution visibility.


The same forces reshaping travel bookings are reshaping every advertising channel, but the impact varies dramatically. Channels that lose visibility or fail to demonstrate performance will see spend shift elsewhere. Those controlling first-party data and direct conversion paths are gaining share (see Figure 3). The resulting hierarchy reflects a fundamental reordering of advertising value.

Figure 3

Ad spend hierarchy: gaining vs. losing share

Image
Figure 3 represents ad spend hierarchy: gaining vs. losing share

Figure 3

Ad spend hierarchy: gaining vs. losing share

Image
Figure 3 represents ad spend hierarchy: gaining vs. losing share

The advertising landscape is evolving unevenly. Channels that combine strong first-party data, precise targeting, contextual relevance or direct conversion capabilities will strengthen, while those reliant on intermediary traffic and proxy metrics face structural decline.

What’s clear is that the models built for the last generation of digital media no longer fit the system taking shape. Advertisers, platforms and intermediaries that recognize this early and reposition accordingly will be better positioned for what comes next.

Navigating the AI transformation in advertising

Navigating AI’s impact on advertising requires both strategic perspective and operational experience. L.E.K. Consulting’s Technology, Media & Telecommunications practice works with leading advertisers, platforms and agencies to assess market shifts, evaluate investment opportunities and build strategies that account for AI-driven disruption.

Learn more about our media industry expertise or contact us to discuss how we can help.

L.E.K. Consulting is a registered trademark of L.E.K. Consulting LLC. All other products and brands mentioned in this document are properties of their respective owners. © 2026 L.E.K. Consulting LLC

English
Executive Insights

Clinical Diagnostic Testing Trends Across Key Modalities: Insights From L.E.K.’s US Diagnostic Lab Survey (2025)

April 23, 2026

Key takeaways

Lab experts anticipate meaningful volume growth across major test modalities over the next three years, supporting a constructive demand outlook.

Molecular testing (NGS, PCR) leads the growth profile, with anatomic pathology advanced staining also expanding; growth is expected to remain concentrated in established disease areas, with oncology being the most consistent driver across modalities.

While many labs will continue to outsource advanced modalities (e.g., NGS, mass spectrometry), a meaningful share of labs, concentrated among AMCs and large community hospitals, anticipates establishing at least partial in-house capabilities over the next three years.

Vendor-switching intent is higher in emerging or advanced modalities (e.g., digital pathology slide scanners), suggesting greater share-shift potential for suppliers that combine differentiated clinical performance with operational efficiency.

Which diagnostic modalities are poised to see the highest volume growth? Which modalities are labs most likely to bring in-house versus continue to outsource? And where is vendor loyalty most likely to shift as the next refresh cycle approaches?

To answer these questions, L.E.K. Consulting surveyed 100-plus executives and directors across hospital and reference labs in our 2025 U.S. Diagnostic Lab Survey. This edition of Executive Insights summarizes expected volume growth, insourcing/outsourcing shifts, and purchasing and switching intent across diagnostic modalities.

Key trends

Test volume growth is expected across modalities, led by molecular and pathology advanced staining

More than 90% of respondents expect in-house test volumes to increase over the next three years, with the strongest momentum in molecular — next-generation sequencing (NGS), polymerase chain reaction (PCR) — and anatomic pathology advanced staining (see Figure 1). Among labs currently running NGS in-house, approximately 65% anticipate double-digit volume growth over the next three years, including 35% projecting growth above 30%, driven by expanding clinical utility in oncology and continued declines in sequencing costs. PCR also shows a strong growth outlook, with around 50% expecting more than 10% growth by 2028, reflecting continued demand and menu expansion in infectious disease (e.g., multiplex gastrointestinal and genitourinary panels).

Figure 1

Expected three-year test volume growth by modality

Image
Figure 1 represents expected three-year test volume growth by modality

Figure 1

Expected three-year test volume growth by modality

Image
Figure 1 represents expected three-year test volume growth by modality

Anatomic pathology, especially advanced staining — i.e., immunohistochemistry (IHC), in situ hybridization (ISH), special stains — is also expected to grow, with a meaningful share of experts projecting double-digit growth over the next three years. Growth is supported by expanding use of IHC/ISH in biomarker-driven treatment decisions, including companion diagnostics, with digital pathology and workflow automation enabling greater scalability.

Other modalities are also expected to grow, but more modestly. Core clinical chemistry, hematology/hemostasis and immunoassay are projected by most experts to grow by 1%-10%, reflecting sustained testing demand and rising chronic disease burden requiring ongoing monitoring.

Oncology remains a key growth driver across modalities, with additional modality-specific growth coming from other therapeutic areas

Across modalities, including higher-growth areas, oncology remains the most consistent growth theme (see Figure 2). Respondents rank oncology among the top three growth areas across major modalities, especially anatomic pathology, NGS, cytology and flow cytometry, reflecting the breadth of testing capabilities needed to support the continued evolution of precision oncology.

Figure 2

Disease areas expected to drive growth in the fastest-growing modalities

Image
Figure 2 represents disease areas expected to drive growth in the fastest-growing modalities

Figure 2

Disease areas expected to drive growth in the fastest-growing modalities

Image
Figure 2 represents disease areas expected to drive growth in the fastest-growing modalities

Outside oncology, respondents identify additional disease areas expected to drive growth within specific modalities.

  • NGS: Growth is expected in genetic and hereditary disorders, driven by expanding germline/ somatic testing and hereditary risk assessment, and autoimmune/inflammation (including transplant), to identify disease etiology and phenotypic gene signatures
  • PCR: Infectious disease is the primary growth driver, reflecting sustained demand for rapid pathogen detection and identification to guide antimicrobial use
  • Anatomic pathology: Alongside oncology, gastrointestinal pathology is cited as a key growth area for both basic and advanced staining, consistent with sustained procedure volumes to diagnose and monitor chronic inflammatory or premalignant conditions

Overall, labs do not anticipate a meaningful shift in the core disease areas served by each modality, with oncology continuing to be the primary growth engine across most modalities.

Expanding across protein-, molecular- and tissue-based oncology solutions can allow suppliers to play a more integrated role in meeting clinical needs across the testing continuum.

Insourcing is expected to increase in select advanced modalities

Operational and workflow complexities continue to shape which modalities are performed in-house versus outsourced. Highly automated, high-throughput modalities (e.g., immunoassay, core clinical chemistry/hematology, PCR) are typically run in-house, whereas a greater share of labs outsource more technically complex modalities such as flow cytometry (35% outsourced), NGS (roughly 45%) and mass spectrometry (around 55%) (see Figure 3). This reflects the need for specialized instrumentation, technical expertise and informatics, which can be challenging for smaller labs to fund and sustain.

Figure 3

Current and three-year outlook for in-house versus outsourced testing

Image
Figure 3 represents current and three-year outlook for in-house versus outsourced testing

Figure 3

Current and three-year outlook for in-house versus outsourced testing

Image
Figure 3 represents current and three-year outlook for in-house versus outsourced testing

Limited shifts toward additional insourcing are expected over the next three years for modalities that are already predominantly performed in-house (e.g., immunoassay, core clinical chemistry and hematology, anatomic pathology). In contrast, greater movement toward insourcing is expected in advanced modalities, particularly NGS: Approximately 20% of labs that currently fully outsource NGS anticipate establishing at least some in-house NGS capabilities in the next three years.

Academic medical centers (AMCs) and large community hospitals account for the majority of planned shifts toward insourcing in advanced modalities (60% for flow cytometry, 59% for NGS and 85% for mass spectrometry), reflecting their scale, technical expertise and investment capacity.

Vendor-switching intent in the upcoming instrument refresh cycles varies by modality, with advanced modalities showing greater potential for share shifts

Across major instrument categories, 60%-80% of surveyed labs expected to purchase a new instrument within the next five years. In high-throughput core platforms, purchasing skews toward replacement and consolidation, with decisions anchored in uptime, service coverage, cost per reportable result and workflow efficiency. In contrast, advanced platforms such as pathology slide scanners, NGS sequencers and mass spectrometry systems are more often intended to expand capacity as labs scale testing volumes.

Current users of advanced modalities report materially higher willingness to switch vendors at their next purchase (see Figure 4), indicating a more competitive installed base relative to mature core platforms. Among current users, approximately 50% of pathology slide scanner users rate themselves “very likely” to switch vendors (6-7 on a 7-point scale), with around 25% for mass spectrometry and NGS sequencers.

Figure 4

Vendor-switching intent by instrument type

Image
Figure 4 represents vendor-switching intent by instrument type

Figure 4

Vendor-switching intent by instrument type

Image
Figure 4 represents vendor-switching intent by instrument type

Elevated switching intent in advanced platforms may reflect evolving needs as labs refine workflows and scale testing volumes, placing greater emphasis on scalability, informatics integration and service support in purchasing decisions. In this context, suppliers that demonstrate both technical differentiation and clear operational impact (e.g., turnaround time, throughput per full-time equivalent, rework reduction) are better positioned in upcoming purchasing evaluations.

Implications for manufacturers and lab suppliers

Strong demand expectations signal positive market momentum for diagnostics suppliers; however, success will require modality- and customer-segment-specific go-to-market strategies.

  • Strong in-house NGS growth expectation; tailor to the adoption and scaling journey

    • For established users: While clinical track record remains central, some labs are open to evaluating emerging platforms that can offer comparable performance with compelling economics and throughput aligned to volume demands.
    • For new adopters (still concentrated among AMCs and large community hospitals): End-to-end enablement plays a key role in reducing implementation friction, including validated workflows and standard operating procedures, applications support, bioinformatics integration, and reimbursement/reporting guidance. This support is increasingly offered by sample-to-answer platforms (e.g., Genexus, forthcoming Axelios) or through service and partnership models that facilitate clinical NGS build-out and ongoing operations.

    Stay tuned for an upcoming edition of Executive Insights discussing NGS testing demand and instrument purchasing trends, including sample-to-answer solutions.

  • Anatomic pathology: Operational efficiency and interoperability shape refresh decisions

    Rising test volumes and workflow complexity, amid continued reimbursement pressure, are placing greater demand on labs to improve operational efficiency. As digital pathology adoption accelerates and slide scanner refresh cycles create switching opportunities, vendors that demonstrate operational efficiency gains and deliver interoperability across the pathology stack (e.g., scanner, IMS, viewer, computational pathology applications) will be better positioned.


    Stay tuned for an upcoming Executive Insights edition discussing digital pathology adoption and instrument purchasing trends.

  • In core modalities, reliability and economics largely drive purchasing decisions

    In high-volume core modalities, limited greenfield adoption means most purchasing is replacement driven. While assay menu breadth and performance can be important differentiators, decisions are largely anchored in operational reliability and sustainable economics, with suppliers competing on uptime guarantees, service level agreements and transparent total cost of ownership.

To discuss these findings and translate modality-level growth into commercial actions across products, services and informatics, please contact us.

A special thank-you to the Healthcare Insights Center for their contributions to this Executive Insights.

Note: Artificial intelligence was used to support the drafting of this article.

L.E.K. Consulting is a registered trademark of L.E.K. Consulting LLC. All other products and brands mentioned in this document are properties of their respective owners. © 2026 L.E.K. Consulting LLC

English
Executive Insights

The Emergence of Direct-to-Consumer Pharmaceutical Platforms: Strategic Implications for Biopharma

April 20, 2026

Key takeaways

Anti-obesity medicines have demonstrated both the viability of novel commercial channels and the scale of self-directed care.

As a result, this dynamic warrants a reevaluation of pricing, access and channel strategy.

The DTC model for prescription pharmaceuticals has moved rapidly from experimentation to mainstream adoption.

Biopharma leaders are increasingly treating DTC as a durable commercialization component rather than a tactical add-on.

When a growing share of new-to-brand prescriptions in select therapeutic classes originates outside traditional channels, brand strategy itself must evolve. Obesity illustrates this shift. Anti-obesity medicines have demonstrated both the viability of novel commercial channels and the scale of self-directed care: Patients know the therapy they want, actively direct treatment decisions and engage outside traditional pharmaceutical pathways.

This dynamic warrants a reevaluation of pricing, access and channel strategy. In this emerging model, direct-to-consumer (DTC) and cash-pay pathways are not peripheral tactics; they shape affordability anchors and demand generation. Companies that fail to adapt risk ceding influence over both the patient experience and the economic logic of their most important assets.

A changing demand landscape and the rise of DTC and self-pay pathways

The DTC model for prescription pharmaceuticals has moved rapidly from experimentation to mainstream adoption. Digitally enabled, patient-initiated pathways reduce friction, compress time to therapy, and offer flexibility between reimbursement and cash-pay access.

In high-demand categories such as obesity, migraine and metabolic disease, coverage gaps and prior authorization barriers have created meaningful access friction. At the same time, patient comfort with virtual care and consumer-grade digital platforms has raised expectations for speed, transparency and convenience. Together, these forces make DTC a credible channel for conditions characterized by high patient activation and relatively standardized clinical decision-making.

Biopharma leaders are increasingly treating DTC as a durable commercialization component rather than a tactical add-on. Platforms such as LillyDirect, NovoCare and PfizerForAll reflect this shift toward more direct, digitally coordinated engagement (see Figure 1).

Figure 1

Pharma DTC platform trend

Image
Figure 1 represents pharma DTC platform trend

Figure 1

Pharma DTC platform trend

Image
Figure 1 represents pharma DTC platform trend

Obesity has been the clearest catalyst. Strong demand combined with uneven coverage has produced a sizable self-pay segment, large enough to sustain manufacturer-led pathways outside traditional benefit structures. A growing share of new-to-brand Zepbound prescriptions now originates through LillyDirect, underscoring DTC’s role in therapy initiation. What began as a niche workaround is evolving into a broader model for engaging, initiating and retaining patients in chronic care (see Figure 2).

Figure 2

Consumer digital experience journey: Pain points and opportunities

Image
Figure 2 represents consumer digital experience journey: Pain points and opportunities

Figure 2

Consumer digital experience journey: Pain points and opportunities

Image
Figure 2 represents consumer digital experience journey: Pain points and opportunities

The evolving DTC value chain: A new commercial architecture

Early DTC efforts were largely promotional or transactional. Today’s models more closely resemble coordinated access architectures that integrate capabilities across the patient experience. Manufacturers increasingly rely on ecosystems of specialized partners spanning telehealth, payments, pharmacy and logistics. No single organization can deliver all capabilities at scale, making thoughtful ecosystem design essential.

Across leading platforms, the DTC journey can be distilled into several core modules:

Digital intake and triage

Consumer-facing onboarding portals, eligibility screening and telehealth scheduling

Clinical evaluation and prescribing

Independent virtual medical groups and e-prescribing systems

Coverage navigation and payment

Benefits verification, cash-pay calculators, affordability programs and payment processing

Pharmacy routing and fulfillment

Specialized mail-order or hybrid pharmacies supporting insured and self-pay flows

Delivery, refills and support

Home delivery or retail pickup, refill automation and adherence support

By bypassing pharmacy benefit managers (PBMs) and wholesalers in self-pay scenarios, these models reduce administrative complexity while enabling multiple engagement pathways. Increasingly, they support both insured and cash-pay patients through a unified experience, expanding choice without adding friction.

Learning from digital health: User experience (UX) lessons from non-biopharma entrants 

Consumer-focused digital health companies such as Hims & Hers, Ro and Noom have set clear expectations for frictionless user experience. Their success reflects a focus on intuitive design, up-front pricing clarity and tightly integrated care models that resonate with patients and increasingly compete with manufacturer-led approaches (see Figure 3).
 

Figure 3

Best-in-class digital customer experience pillars for obesity care

Image
Figure 3 represents best-in-class digital customer experience pillars for obesity care

Figure 3

Best-in-class digital customer experience pillars for obesity care

Image
Figure 3 represents best-in-class digital customer experience pillars for obesity care

Key non-biopharma UX learnings:

  • Consumer-first onboarding framed around goals rather than diagnoses
  • Streamlined, linear journeys with minimal handoffs
  • Clear self-pay pricing and subscription options
  • Integrated telehealth, pharmacy and support
  • Retail-grade fulfillment and proactive refill flows
  • Ongoing behavioral engagement to reinforce adherence

As biopharma scales DTC platforms, matching or exceeding these experience standards will be essential to sustaining patient engagement and trust.

Imperative for biopharma leaders

As DTC and digitally coordinated models mature, the question for commercial executives is no longer whether to participate, but whether they are actively shaping patient engagement for the right assets. These models are not universally applicable. Highly complex, provider-anchored therapies, such as oncology, will remain rooted in traditional care settings. In contrast, medicines characterized by high patient activation, standardized clinical decision-making and meaningful access friction are being increasingly influenced by digital pathways.

For those assets, DTC cannot remain a pilot or side initiative. It requires deliberate executive action across three imperatives:

View DTC as a catalyst for brand strategy, not an add-on

Be explicit about what DTC is meant to unlock. It may require breaking from legacy pricing logic and elevating accessibility and affordability over price maximization. DTC should not sit adjacent to the brand strategy. It may redefine it.

Commit to an operating model, not just a platform

Decide where control is essential and where partnerships are sufficient. Clarify which parts of the patient experience must be closely governed to ensure clinical integrity and compliance, and which can scale through external partners.

Activate demand with intent

Be deliberate about how patients are discovered, guided and supported. Focus digital activation on points in the engagement journey where early intervention changes outcomes, and prioritize assets where shaping engagement creates lasting advantage.

Competitive advantage will not come from launching a DTC presence alone. It will accrue to organizations that make intentional choices about how they engage patients digitally, where DTC fits within the portfolio and which brands are allowed to meaningfully shape the patient experience.

For more information, please contact us.

L.E.K. Consulting is a registered trademark of L.E.K. Consulting LLC. All other products and brands mentioned in this document are properties of their respective owners. © 2026 L.E.K. Consulting LLC

English
Image
The embedded payments playbook cover
Special Report

The embedded payments playbook: Accelerating portfolio value

May 18, 2026

Embedded payments are gaining traction. Yet they remain one of the most underexploited growth levers for private equity sponsors and their software platforms.

This playbook, coauthored with Worldpay for Platforms, explores to move from “set-it-and-forget-it” payments to deliberate operating models, risk ownership and merchant activation that turn payments from a secondary feature into a core growth engine at both the platform and portfolio level.

There is a persistent misconception that payments are a “set-it-and-forget-it” profit engine. In practice, value materializes only when platforms make deliberate choices about operating model, risk ownership and merchant activation, and execute consistently over time.

For many platforms, payments remain secondary. For others, they are becoming a core growth engine.

In this report, we outline a practical approach to capturing that opportunity at both the platform and portfolio level, from aligning monetization models to embedding payments into workflows and improving unit economics.

Download the full playbook to explore the frameworks and actions required to turn embedded payments into a scalable, repeatable value-creation engine.


English
Special Report

Enabling Development of Aluminium Recycling Capability in Australia

April 20, 2026

Australia is a global leader in bauxite mining, alumina refining and primary aluminium production, yet almost all aluminium scrap generated domestically – around 440 kilotons (kt) each year – is exported for remelting offshore. Establishing domestic recycling and remelting capability is therefore not about fixing a waste problem – it is instead about capturing economic value, strengthening sovereign capability, reducing emissions intensity and meeting growing customer demand for lower-carbon, recycled materials.

With coordinated policy action, Australia can transform a lost opportunity into a national advantage. This Special Report, produced in partnership with the Australian Aluminium Council, outlines how this can be achieved. 

Download the full analysis now.

English

2026 Education Investment Landscape in APAC

April 20, 2026

L.E.K. Consulting’s Global Education Practice examines the key trends shaping education investment in the APAC region. This webinar provides insights into major transactions from 2025 and explores the themes expected to drive activity in 2026.

Watch the recording to stay informed on the evolving market dynamics and opportunities in the sector.

English

Reconnecting Strategy to Financial Performance in Private Banking

April 17, 2026

Background and challenge

Global wealth continues to expand, with assets increasingly concentrated among high- and ultrahigh-net-worth individuals. This shift is creating new opportunities in private banking, where clients expect highly personalized services, differentiated advice, and access to alternative investments. Growth, however, is uneven: While wealth expands rapidly in Asia-Pacific and the Americas, European markets remain relatively stagnant. In this environment, smaller private banks can compete through agility and specialization, while mid-scale institutions often struggle to balance growth ambitions with structural cost constraints.

A boutique private bank with a strong institutional heritage and differentiated client proposition faced increasing pressure to translate its positioning into sustainable financial performance. While client loyalty remained high, growth initiatives were fragmented and leadership lacked a clear strategic roadmap to capture emerging wealth opportunities across regions and products.

The bank engaged L.E.K. Consulting to help define its long-term strategic direction, align the leadership team around a clear growth vision, and develop a value-creation roadmap grounded in quantified financial outcomes. Leadership sought clarity on which growth initiatives would drive sustainable revenue expansion while strengthening profitability and operational scalability.

Approach and recommendations

L.E.K. conducted a structured assessment of the bank’s strategy, business model, performance and operating structure to establish the foundation for a clear value-creation roadmap.

The review surfaced two critical findings. First, the bank’'s cost base reflected legacy operating assumptions rather than forward-looking revenue realities. Staffing levels, governance, processes, technology, and service models were calibrated for historical growth, resulting in a complex operating structure that limited the bank’s ability to pivot with market conditions and drive profitability. Second, high complexity and an inefficient operating model led to an increasing cost-to-income ratio (CIR), which in turn limited growth. The bank was working harder just to maintain the status quo. Additionally, with capital invested in an inefficient operating model, profitability declined, and return on equity (ROE) fell. The operating model also became less resilient as complexity increased.

L.E.K. worked with the executive leadership team to refine the bank’s strategic vision and mission, aligning leadership around a differentiated positioning in the global private banking landscape and clarifying the strategic priorities required to support long-term growth. Additionally, the team developed a focused go-to-market strategy across key regions. This included market sizing and growth analysis in priority wealth markets, identifying target client segments, and evaluating regional expansion pathways, including licensing requirements and operational setup considerations.

To develop an effective growth plan, L.E.K. helped the bank evaluate how current initiatives could deliver stronger financial outcomes within its existing operating model. This included developing a segmented profitability view across client groups and products, identifying structural cost drivers in legacy servicing and delivery models, and highlighting additional revenue levers such as Lombard lending, structured financing solutions, and pricing discipline to strengthen client wallet share and revenue growth.

Results

L.E.K.’s analysis helped the bank prioritize initiatives that could deliver the greatest measurable impact, while streamlining its current cost structure. By identifying areas of complexity and excess in the legacy model and pinpointing initiatives with the highest potential returns, we helped the client develop a value-creation plan that:

  • Aligned the operational cost base with forward-looking growth scenarios;
  • Qualified execution milestones tied to CIR and ROE improvement, thereby embedding financial discipline into decision-making

Implementation of this roadmap delivered:

  • Achievement of a 13% ROE target
  • 10% compound annual growth in assets under management
  • A 20 percentage point improvement in CIR  
English
Subscribe to