Volume XXVII, Issue 38 |

In this Executive Insights, we look at the UK productivity puzzle and a particular causal factor relevant to L.E.K. Consulting’s work that is one of the toughest questions our clients often face: What is the role of private capital investment?

In the latest government announcement on 15 May 2025, UK labour productivity was 0.2% lower compared with a year ago (comparing Q1 2025 with Q1 2024). The last time the UK observed meaningful growth in this measure — albeit a lacklustre 1.0% year-on-year growth1 — was Q3 of 2022. Since then, it has been flat or in decline. The latest figure (Q1 2025) was just 1.1% higher (in aggregate, not per year) than prior to the pandemic, Q4 2019, over five years ago.

The longer-term view does not provide further comfort. Figure 1 shows the development of the UK’s labour productivity since 1980, revealing a clear trend across each decade.

In the 1980s, the UK achieved 2.2% per year improvement in productivity in real terms (i.e. above inflation). Whilst this growth may seem modest, it implies a doubling in labour productivity every 32 years, and therefore that a typical Generation X worker — born in the 1960s — could expect to earn double what their parents earned, even after taking inflation into account.

In the 1990s, the pace of productivity improvement increased, averaging 2.8% per year, or a doubling in productivity every 25 years.

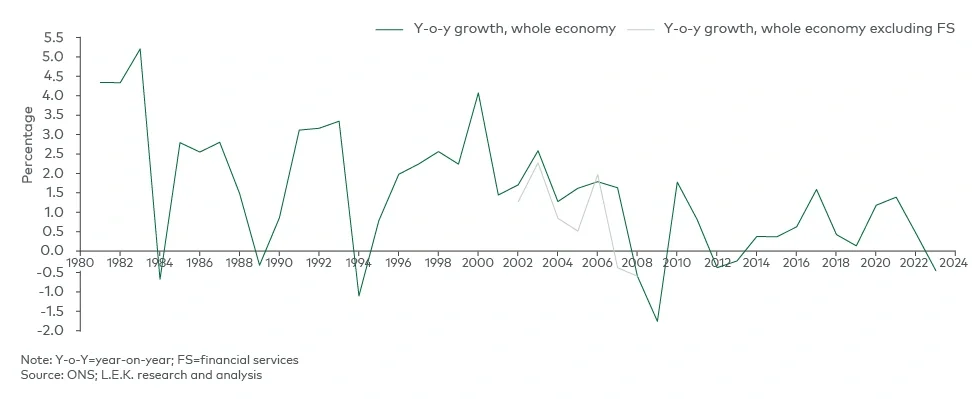
The global financial crisis of 2007-2009 (GFC) dominates the landscape of productivity growth in the 2000s and 2010s, and many have commented on the apparent step change that can be observed on either side of the financial crisis. From 2001 to 2007, productivity growth averaged 1.8%, and from 2010 to 2019 — in the wake of the GFC — it was only 0.4% per annum. (At this rate of growth, it would take fully 160 years to double productivity, which pushes the boundaries of economists’ understanding of ‘in the long term’.)

But is the GFC — and the constraints that it imposed on the availability of capital — at the heart of the decline? Perhaps not, and certainly not entirely.

What is less often observed is that this 2008 bust — which began in the global financial services (FS) sector — was preceded by an equally dramatic boom which saw the FS sector in the UK grow labour productivity by 55% from 2001 to 2007. Once the impact of this small element (noting that FS accounts for around 8% of the UK economy) is removed, the productivity growth in the rest of the economy was only 0.8% per annum from 2001 to 2007, equating to a doubling in productivity every 85 years — a lifetime, not a generation. 

This is the UK productivity puzzle, and it seems to date from at least the early 2000s.

Generation Z children, born in the 2000s, are today graduating and entering a workforce that is barely more productive than when they were born. The problem is older than Facebook (2004), YouTube (2005) and Twitter/X (2006) — and indeed older than ‘Strictly Come Dancing’ (2004), ‘The Apprentice’ (2005) and ‘The X Factor’ (2005).

With all these new ways to communicate, to connect to information, and to find talent, why have we not solved the productivity puzzle?

There is a huge prize at stake. Had the UK’s productivity grown at the 1980s-1990s average rate (2.5% per year across both decades), today we would each be earning 36% more, or an extra £37 per hour.

But what are the causes?

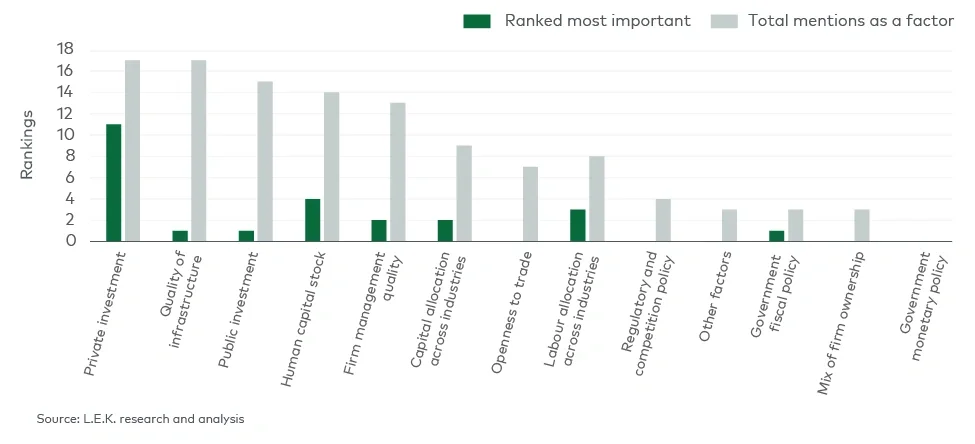
In a July 2024 survey of the literature and expert views, L.E.K. asked 26 UK academic experts on productivity for their views on the causes.2 The results are shown in Figure 2.

The survey offered the 26 economists a range of factors to select from, and “private investment” was ranked as the most important factor and shared the top spot in total mentions.

By private investment, we mean capital invested by the private sector for a range of purposes: to allow start-ups to scale, covering their start-up losses and capital programmes; to invest in equipment, machinery and systems; and to invest within businesses in new ventures or services. Investment in this context includes any expenditure that is designed to improve or grow a business that would not be necessary just to maintain the business.

When investment is too low, the explore-versus-exploit choice has tipped too far towards exploitation and the reward for exploration has become too low. Exploring involves taking risks, because it is hard to know whether the changes or initiatives being invested in will work out, and often they do not. New business ventures often fail, and capital invested in them is therefore lost. However, in aggregate and across a portfolio of such investments, the returns need to be (and used to be) high enough to pay back the capital and provide a reward for taking that risk.

The evidence for a shortfall in private investment is strong

The Organisation for Economic Co-operation and Development (OECD) data for gross fixed capital formation (GFCF) since 1980 is shown in Figure 3. The Y-axis represents GFCF as a percentage of GDP. The grey and green lines show the range across all OECD countries in each year from very low GFCF (in light grey) to very high GFCF (dark green). We also show the bottom and top quartile boundaries. The UK is shown in orange.

The UK is mostly below the bottom quartile line (i.e. in the fourth quartile). There was a period from 1983 to 1990 when the UK invested relatively more and was in the third, and sometimes second, quartile. Since 1991, the UK has been in the fourth quartile in every year.

Over this entire period, the UK invested on average 19% of GDP in GFCF. Some comparable economies invested more — the US, France and Germany were all at 22%, for example. Other advanced economies, such as Switzerland (28%) and Australia (26%), invested much more on average across this period.

The OECD data defines capital as tangible assets, including buildings, machinery and equipment. This therefore excludes intangible investments such as software. The mix of industries is a factor because it would be mostly industrial activities, including manufacturing, primary industries, construction and distribution, which use significant tangible capital. These activities make up 37% of the UK economy versus 47% on average across the OECD, and this may account for some of the difference in Figure 2. 

Nevertheless, the size of the gap shown above is large enough to conclude, as did the economists in the survey, that low private capital investment is a problem in the UK.

The same OECD data set can be linked to growth in labour productivity. If the investment is successful (overall across the portfolio within a country), then we would expect higher rates of investment to lead to higher growth in productivity. Looking at the period from 2000, on a decadal basis (so the 2000s and then the 2010s), picking up the different investment environment before and after the GFC, we can plot the average investment over a decade (as a percentage of GDP) against the growth rate in labour productivity over the same decade. 

Each OECD country appears twice in the chart (one spot for each decade). There is a strong statistical relationship (*): If GFCF is below c.20% of GDP, labour productivity does not grow. For each 1 PPT increase in GFCF, labour productivity grows by around 0.7% per year faster. The statistics are also valid (and very similar) when looking at each decade separately.

(*) P-value 2x10^-7 and T-stat 5.8; similar results for each decade. In both decades, the UK was in the bottom (worst) quartile on both capital investment and labour productivity growth (see Figure 4).

It is important to highlight that this relationship assumes that the additional capital investment is productive and profitable. The acceleration in labour productivity growth is not a simple Keynesian result of adding capital expenditure into the GDP equation. If it were just spent on wasteful projects, the benefit would not outlast the expenditure and GDP could simply increase and then fall back without impacting labour productivity at all. 

The relationship shown in Figure 4 is based on additional capital expenditure resulting from private investors identifying and making profitable investments that improve productivity.

As a sample scenario, if the UK were to increase GFC by 3% of GDP and so move to the right on the chart by 3 PPT, the statistical relationship suggests that growth in labour productivity would improve by 2.1% per year and reach 2.5% per year, the average rate achieved during the 1980s and 1990s. Generation Alpha would eventually earn twice what their parents did. This would require an additional £86 billion per year (in 2024 prices, i.e. 3% of the 2024 nominal GDP of £2,851 billion).

Why is this not happening?

In terms of capital that could be invested, the UK public holds £1.9 trillion in net financial wealth (2022 figure, the latest published by the Office for National Statistics in January 2025). Of this, £1.2 trillion is in cash deposit accounts, in cash individual savings accounts and with National Savings & Investments — deposits that are not invested in businesses or other enterprises. This does not include equities, property or pensions, and so this figure represents liquid financial wealth which could be mobilised to invest. This is enough for 14 years of the additional investment of £86 billion in our scenario above. Therefore, the problem is not a shortage of capital.

It also seems that the UK is not short of investable ideas. The ONS recorded 316,000 ‘business births’ in 2023, which is about one per hundred workers.

Addressing the investment gap

We are left with the task of understanding why the UK's substantial pool of capital and strong pipeline of investable ideas are not combining to create profitable investments as productively as in other countries or past UK generations. Are the incentives to invest strong enough? And if not, how can the UK environment become more fertile ground for private capital investment in the future?

For more information, please contact us.

L.E.K. Consulting is a registered trademark of L.E.K. Consulting LLC. All other products and brands mentioned in this document are properties of their respective owners. © 2025 L.E.K. Consulting LLC

Endnotes
1ONS.gov.uk, “UK Whole Economy: Output per hour worked % change per annum SA.” https://www.ons.gov.uk/employmentandlabourmarket/peopleinwork/labourproductivity/timeseries/lzvd/prdy 
2Economic-insight.com, “The UK Productivity Puzzle: A Survey of the Literature and Expert Views.” 

Questions about our latest thinking?

Related Insights