For decades, the insurance broking industry has relied on a limited pool of key metrics of which new business, retention rate and commission are core and have served businesses well. However, the market today is very different from what it looked like a decade ago, as the influx of private capital has transformed the scale of businesses, the level of competition and sometimes the mode of growth. This is complemented by deployment of technology and access to data at a scale that is unprecedented in the sector. Given these changes, it is time to consider the best ways to understand business performance that allow targeted action and measurement of cause and effect to enable more sustainable, organic value creation.

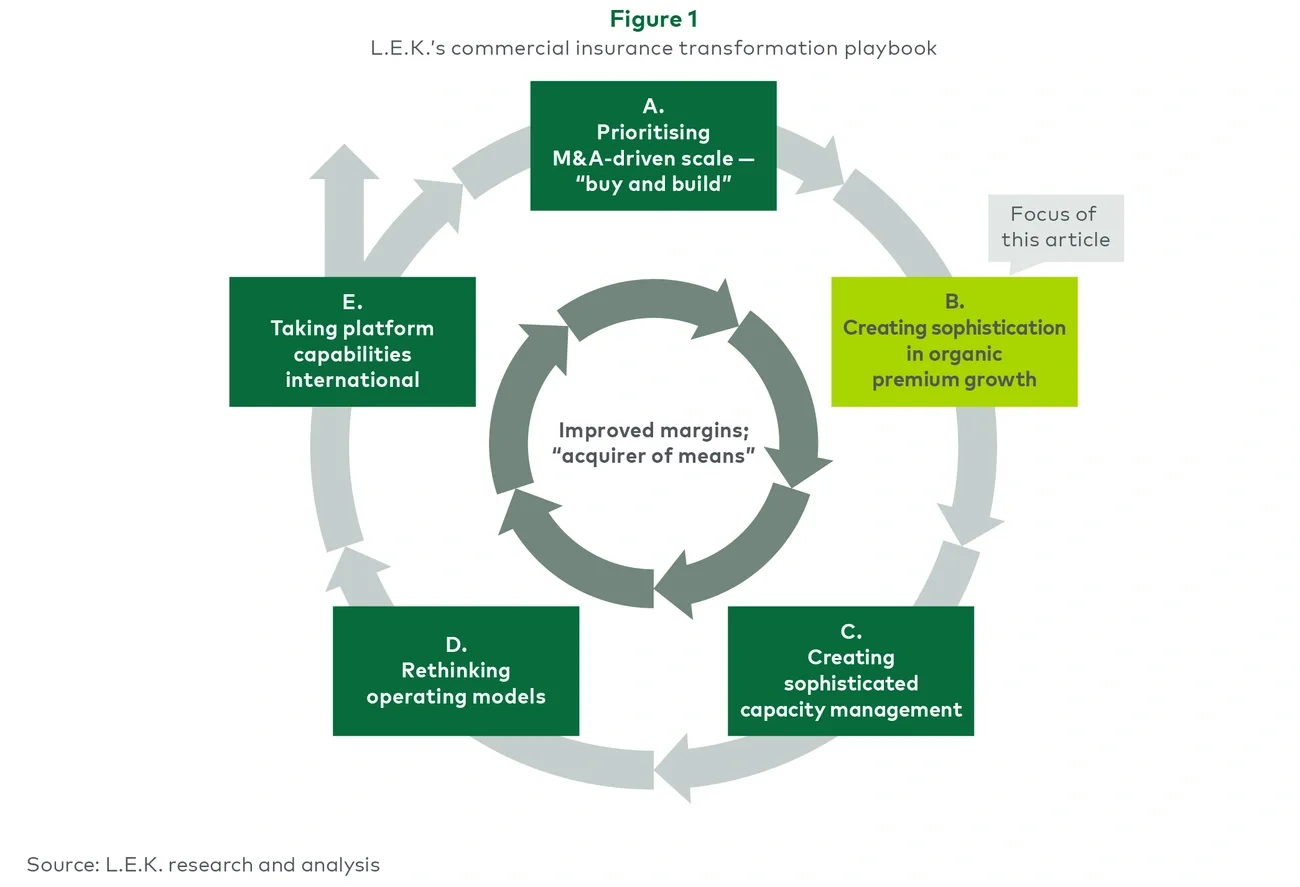
In our previous report “In the Foothills of Excellence: Spotlight on Commercial Insurance Broking,” L.E.K. Consulting proposed a commercial insurance broking transformation playbook with five growth levers (see Figure 1).

As the industry consolidates and players in more mature markets (like the U.K./U.S.) see increased competition for deals, individual participants’ ability to differentiate on all these levers will drive their ability to be an acquirer of means (i.e., be able to clear the M&A market on entry multiples) and act to provide the potential for synergies of learning to new international markets where operational or capacity strategies with the home platform are harder. Of these five levers, organic growth remains a critical value lever given its outsized impact on equity value creation, but it is also often the last one considered given the challenges of connecting cause and effect. To drive organic growth, customer segmentation and strategy are key to understanding customers and subsequently informing the key performance indicators and metrics to measure the impact of strategy, followed by aligning incentives to change behaviours and outcomes, all of which is embedded in a commercial cycle (see Figure 2).

In our experience, a key shortfall is the bluntness of historical industry metrics that have not kept pace with the needs of modern insurance brokering businesses. Of the metrics that are typically used, new business and retention act to constrain management teams as they hide the significant value in the back book and existing client relationships. These can be mined and optimised in addition to driving new business generation. 

The key to unlocking this is a business’s ability to understand its customers and their needs and view traditional metrics in a new light — e.g., breaking down retention into its components (see Figure 3) — as only with this perspective can teams unlock new opportunities. A shift in mindset and a focus on increasing the value of the interactions that brokers have with their customers can provide mutual benefit for all. With the right data and well-understood (and visualised) metrics across the organisation (from executive to front-line staff), management teams can improve organic growth rates and create new revenue streams that underpin (and underwrite) the payment of higher multiples for future M&A while also increasing the overall platform multiple at the time of sale.

A fresh perspective on MI for insurance brokers

To make sure we get value from a new way of looking at the book and growth, we need a reporting framework that is 1) actionable, 2) explainable and 3) impactful (see Figure 4). Revenue retention rate metrics as used today typically fail the actionable and explainable tests as they aggregate a whole range of activities (like increasing/decreasing coverage, the impact of rate movements, and client loss). As such:

  1. Actionable: Employ metrics that closely link to management actions and / or initiatives such that a change in performance can be envisioned and driven. For example, the “average penetration of product by customer group” is a good metric to understand the current penetration level by product and customer. If the average penetration of cyber insurance across logistics customers with 30-50 employees is 20%, then this benchmark can be provided to front-line brokers visiting other clients as part of the renewal process to create a value-add and needs-based conversation. 

  2. Explainable: It can be difficult to diagnose the exact source of growth (or decline) in key lines of the profit and loss (or cash flow), but this can be aided by defining and utilising metrics that break down higher-level metrics into their underlying movements (i.e., new business, client loss or segment-level revenue growth) and can be unpacked at different levels of aggregation (e.g., customer segment, branch, broker) (see Figure 6, below). 

  3. Impactful: Linking these two concepts of explainable and actionable ensures that metrics are impactful and that initiatives and their associated investment have real measurable benefits.

The three qualities constitute a virtuous cycle for what good looks like with respect to metrics and support a cycle of continuous improvement (see Figure 4). 

Learning from sectors with similar business models (e.g., software as a service (SaaS)/tech businesses)

Looking more broadly into other sectors, the insurance broking industry shares a similar business model with subscription based XaaS businesses (could be SaaS, PaaS or IaaS), as both rely on annually renewing customers for a sustainable revenue stream and attracting new customers to grow. Here, tech companies are typically more advanced in how they think about organic growth through using a suite of very granular and intricate metrics aligned to clearer staff incentives. Annual recurring revenue (ARR) is one such metric; ARR represents the stock of revenue in the books and more easily allows examination of momentum without the impact of seasonality (see Figure 5). It focuses management teams on monthly adds/losses of clients as well as contract expansion/contraction (and the net of these movements) — it enables businesses to track the health of their subscription base over time more effectively. Furthermore, such metrics are strongly favoured by investors for the revenue explainability and predictability and can be easily expanded to include growth from M&A. Taking this approach to understanding organic (versus inorganic) growth could be transformational for teams thinking about how to manage performance. 

L.E.K. has helped formulate a new set of metrics for our clients’ management teams and embedded these in dashboards for easy exploration. These have been shared across organisations and have become a central part of the commercial cycle. This approach has enabled the analysis of performance and powered data-driven actions in the most effective way. 

Figures 6 and 7 are two snapshots from the dashboard. Figure 6 provides a reporting view at different levels and time scales, depending on the audience. This top-down view is particularly helpful for the management teams in regular business reviews to help explain what is driving the trend in overall portfolio growth and has led to a quicker set of management interventions to mitigate emerging risks and visualise the value of growth initiatives. Figure 7 provides a bottom-up view of the business on a customer level and is a huge value-add to individual brokers, who can leverage data on their clients and utilise benchmarks to understand their next best action and more effectively drive cross-sell/up-sell in the right product classes for each customer segment. As a result, brokers can effectively target the correct customer needs and promote the relevant products, significantly improving average value per customer. Effective interventions by brokers with clients can be quickly highlighted and best practices rapidly shared across the organisation. 

L.E.K. has worked on numerous engagements to help clients build up their management reporting capabilities and transform the ways they think about and visualise their businesses. This type of initiative is no longer a complex information technology project; instead, we help you develop an insight layer on top of existing policy administration systems (PASs). There are many more ways to unlock the value of data that insurance brokers hold beyond this. The framework is capable of being extended into other areas, such as commission analysis, broker and support activity assessment, and opportunities for automation to drive further value. We see this monetisation of data assets as a core part of the next phase of growth for the ever-larger, more sophisticated businesses in the market.

For more information, please contact strategy@lek.com

L.E.K. Consulting is a registered trademark of L.E.K. Consulting LLC. All other products and brands mentioned in this document are properties of their respective owners. © 2023 L.E.K. Consulting LLC

Three InsurTech Opportunities That Insurance Players Should Seize Today
person using phone
In the legacy insurance industry, direct sales, broader risk categories and personalized solutions are opening the door to InsurTech. Here’s what some of the opportunities look like.

Related Insights