The backdrop: 2025’s tariff overhang and jittery consumers

Tariffs have certainly been at the center of business planning in 2025. With the stop-start dynamic of tariff policies, it has been hard to understand how much prices are actually changing at checkout.

Regardless, consumers have noticed. While prices have been steadily rising these past few months, the latest L.E.K. Consulting consumer sentiment pulse surveys highlight that consumers expect to shoulder the expected rise in costs, feel they are already paying more than they’d like and thus expect to tighten their budgets.

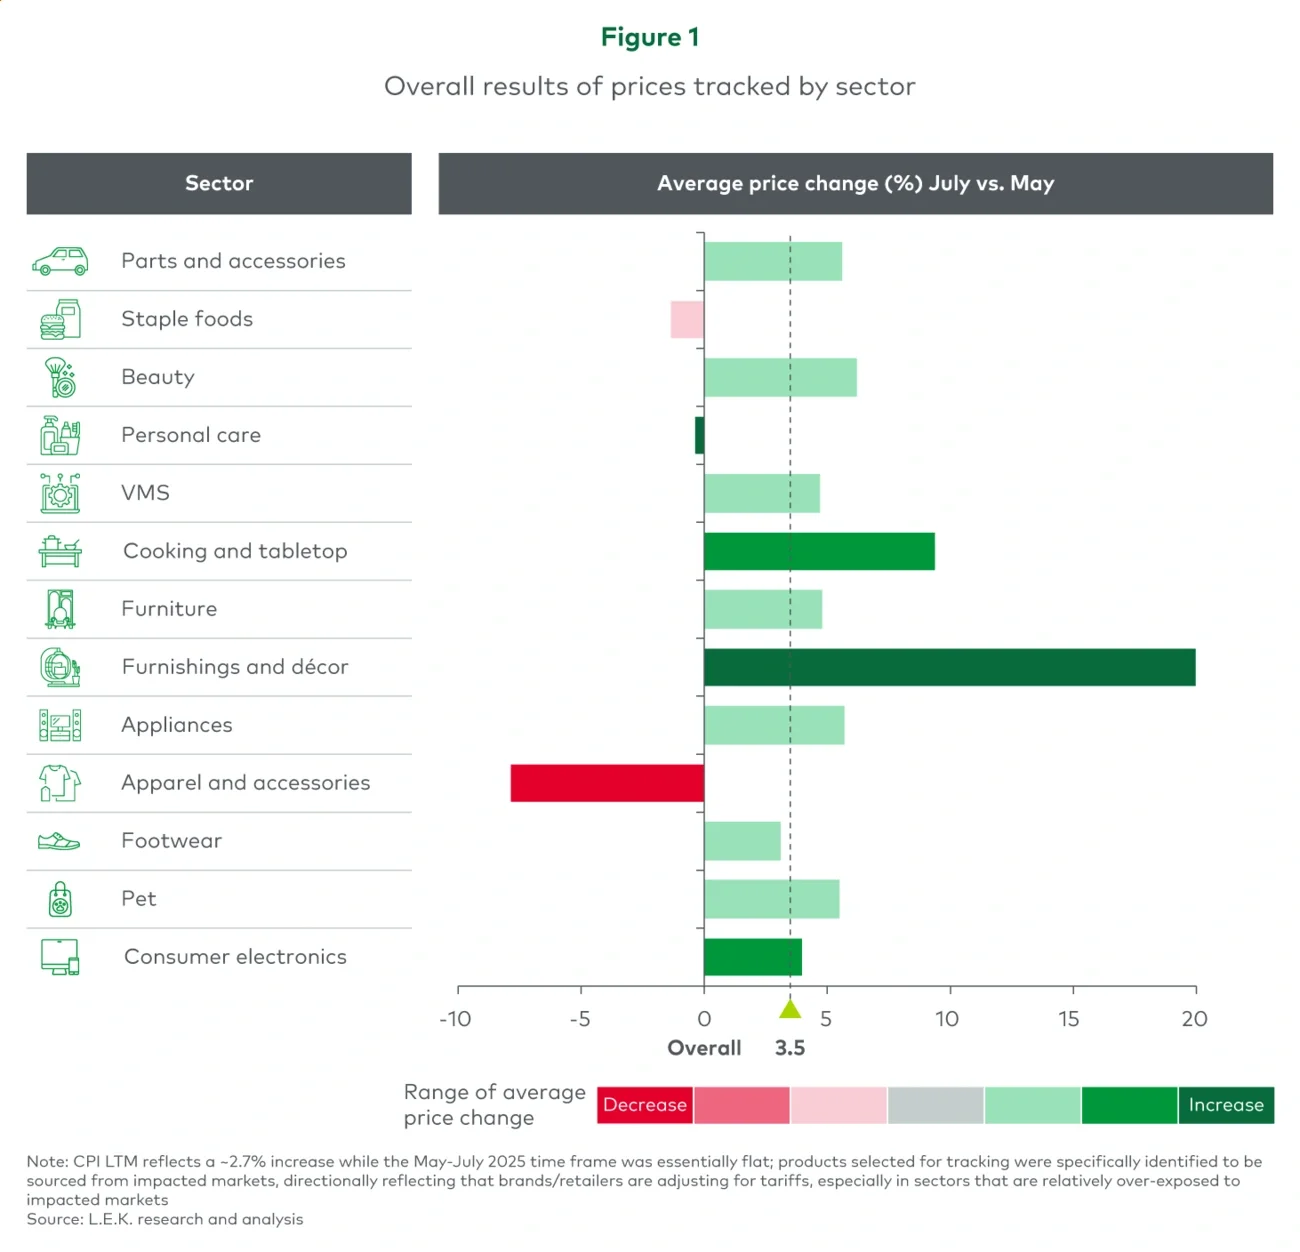
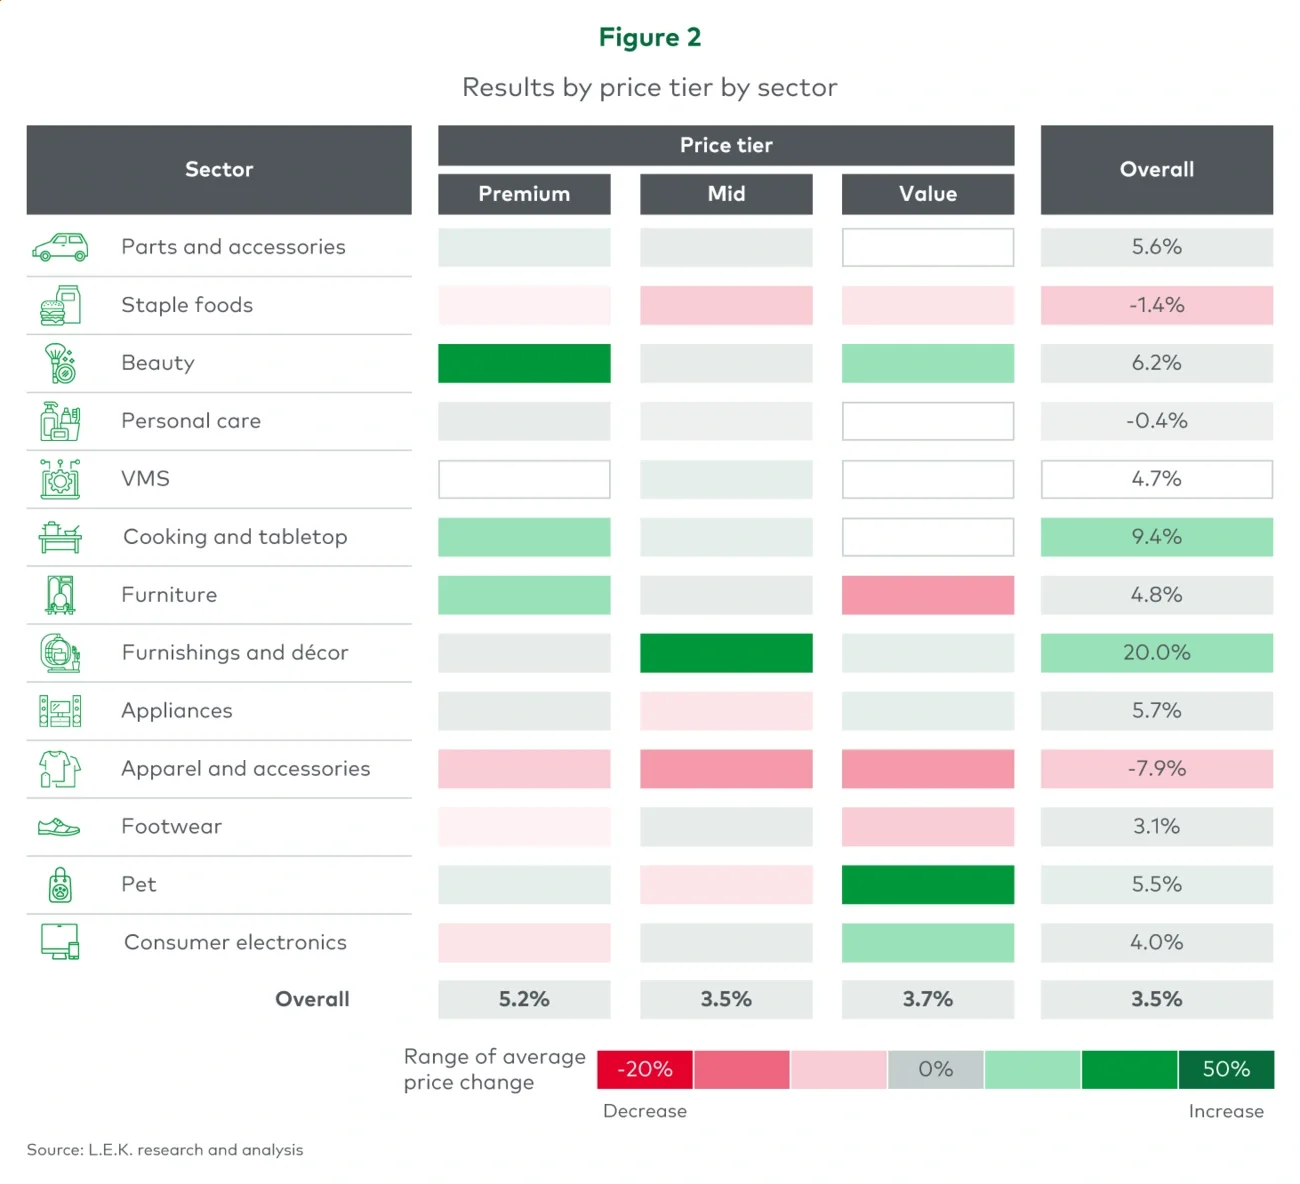
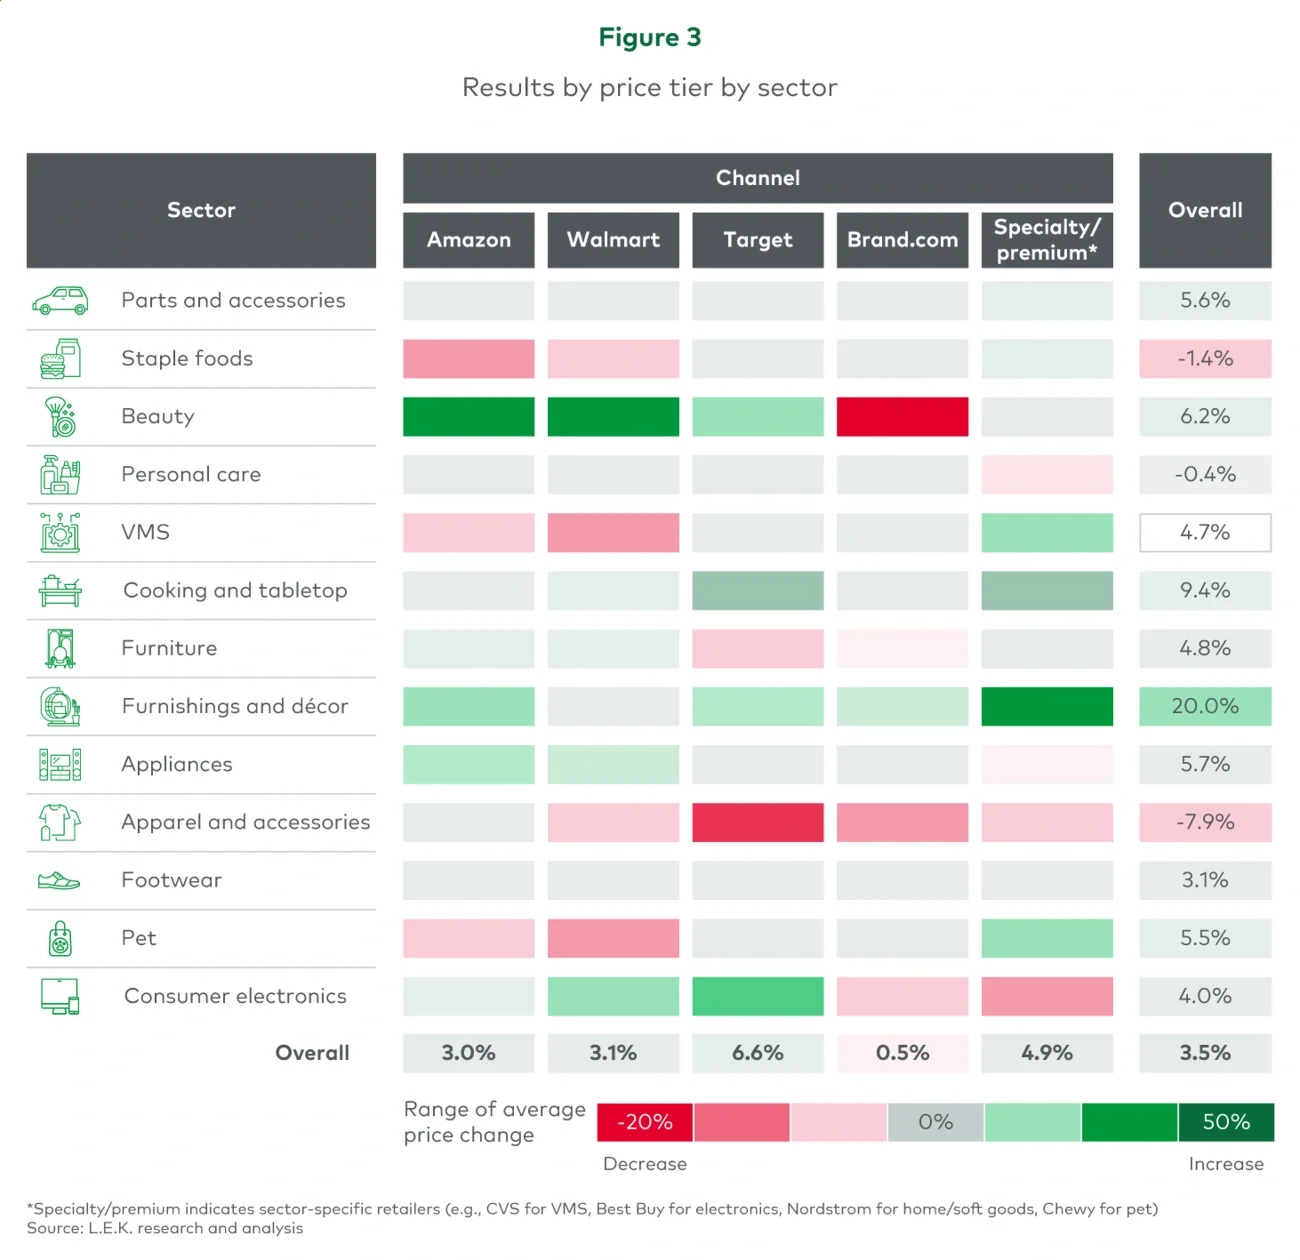
To further separate noise from signal, we tracked prices for approximately 300 stock-keeping units (SKUs) across six consumer sectors and about 130 retailers during that same time frame and found that net prices rose roughly 3.5% on tariff-exposed goods.

What we found: Prices did increase, but unevenly

The amplitude of price changes varied by category, price tier and channel (see Figure 1). Premium tiers and specialty channels did more of the “heavy lifting” on absolute price points; value channels emphasized stability. More specifically:

  • Household essentials were steady (flat to slightly down) as retailers prioritized price image and trip loyalty in these aisles.
  • Meanwhile, discretionary goods spiked, especially in home goods (e.g., cooking and tabletop) and beauty.
  • Consumers feel it most in big-ticket discretionary categories such as household durables, where the highest share of respondents in our pulse surveys say they are now paying “above acceptable” levels. This was consistent with price-scraped findings.
  • The apparel and accessories category is the price-cut outlier. We have seen in our consumer work that apparel is the key area where consumers will reduce spend in response to tariffs. That behavior is consistent with the market actually cutting average prices using more promotional activity as they work through pre-tariff inventory based on a likely higher level of demand. 

Figure 1. Overall results of prices tracked by sector

  • Price tier dynamics: broadly speaking, premium products went up, value went down. As seen in Figure 2, outside of furnishings, premium SKUs led the increases; value-tier SKUs were further reduced to sharpen the price ladder and protect share.
  • Food and beverage showed how the middle squeezes its pricing to defend against private label. These SKUs nudged down by almost 4.5% to straddle shoppers trading between national brands and fast-growing store brands. This aligns with market data: U.S. private labels hit record shares in 2024 and continued to outgrow brands in 1H25.
     

Figure 2. Results by price tier by sector

  • Retail channels behaved true to their perceived value positioning (see Figure 3). Specialty/premium retailers tended to pass through costs to shoppers with a higher willingness to pay and with brand affinity, while brand.com and value players (e.g., Amazon, Walmart) largely held the line on everyday-low-price image, likely leaning on mix, pack/size and supplier funding to maintain shelf discipline.

Figure 3. Results by channel by sector

So what? Pricing in a tariff era requires precision, not posture

The through line in 2025 is uncertainty: Policies continue to toggle on and off, more attention is paid to price increases, companies attempt to manage their tariff exposure and consumers are primed to believe they’ll foot the bill. This cocktail makes broad, blunt price moves risky. 

Instead, these findings argue for precision and agility; be surgical with your pricing by product, tier and channel but also use both gross pricing and promotional activities to optimize. 
This means taking a hard look at the current cost vs. value-based pricing strategies, a refresh of your portfolio and price-pack architecture, and a more surgical assessment of current promotional strategies to balance driving value and traffic vs. margin. 

It is critical for brands and retailers to set themselves up for success as families ramp up for the holiday season. Please reach out to us to go deeper into these sector- and SKU-level patterns and how we can help operationalize these findings.

Postscript 
Our methodology
L.E.K. tracked prices for approximately 300 SKUs across six consumer sectors and about 130 retailers. We focused on widely purchased tariff‑exposed or adjacent items to understand how sectors, brands and channels actually adjusted shelf prices as policy uncertainty unfolded (see Figure 4).

Figure 4. Overview of sectors, categories and specific products tracked

L.E.K. Consulting is a registered trademark of L.E.K. Consulting LLC. All other products and brands mentioned in this document are properties of their respective owners. © 2025 L.E.K. Consulting LLC

Related Insights