Multidisease assets drive disproportionate value
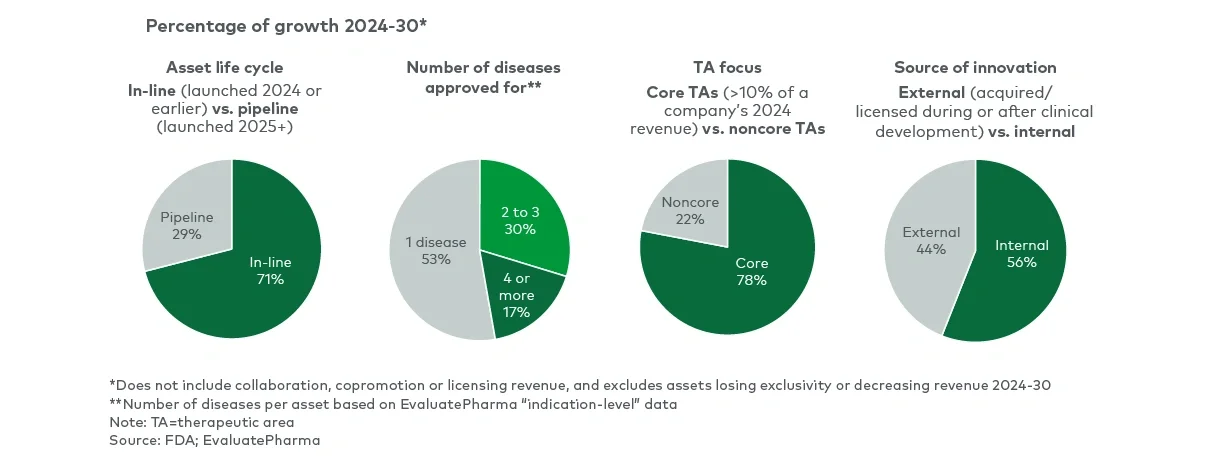
“Portfolio-in-a-product” assets — therapies with the potential to address multiple diseases — are emerging as some of the most powerful growth drivers among the top 15 companies. Although they represent only about one-third of the combined portfolio density, these multi-indication assets are expected to account for nearly half of total projected revenue growth.
Notably, just 13 such therapies, each spanning four or more indications, are set to deliver nearly 20% of topline expansion through 2030. Their outsize impact is a key differentiator between higher- and lower-growth players: The top five companies alone anticipate over $100 billion in growth from these assets — more than double the combined contribution expected from the bottom 10.
This underscores a critical strategic consideration. Therapies with the potential to scale across multiple diseases should be prioritized, as they offer not only greater revenue potential but also improved return on R&D and commercial investment.
Core therapeutic areas drive the majority of growth
Nearly 80% of projected revenue growth through 2030 is concentrated in core therapeutic areas — those already accounting for at least 10% of a company’s revenue.
This trend highlights the strategic advantage of building from a position of strength. By doubling down on familiar territory, companies can leverage established scientific expertise, trusted stakeholder relationships and existing commercial infrastructure to develop evidence strategies that resonate, accelerate launches, optimize access and gain share more efficiently than in less-familiar therapeutic areas.
In an environment defined by growing scientific complexity and mounting commercial pressure, companies that deepen their presence and enhance execution in core areas will be best positioned to drive consistent, capital-efficient growth.
Finding the right balance between external innovation and organic growth
External innovation — through M&A, in-licensing or strategic partnerships — remains a critical engine of growth in biopharma. Projections through 2030 show revenue growth is nearly evenly divided between internally developed assets and those sourced externally during or after clinical development. This balance does not yet reflect future deal activity, which is likely to tilt the mix even further toward external innovation over time.
This dynamic highlights a key strategic imperative: Companies must carefully balance internal R&D with external sourcing to remain competitive. Overdependence on internal pipelines can limit exposure to novel modalities and emerging science, while excessive reliance on external innovation may compress margins, introduce integration challenges and reduce long-term pipeline visibility. Striking the right balance is essential for sustained, capital-efficient growth in an increasingly complex and competitive landscape.
Key implications for pharma executives
Future growth in biopharma will depend on deliberate, insight-driven portfolio choices. The next generation of outperformers will distinguish themselves by reconfiguring their portfolios around a few core strategic principles:
- Elevate post-launch execution and life cycle management
Treat post-launch execution with the same strategic rigor as clinical development. Prioritize indication expansion, global market penetration and long-term value creation to fully realize the potential of in-line assets. - Double down on high-impact, scalable assets
Focus investment on a select group of high-conviction programs with label expansion potential. Concentrating capital behind these assets can unlock disproportionate returns and build momentum across the portfolio. - Leverage strength in core therapeutic areas
Deepen presence in therapeutic areas where scientific expertise, stakeholder relationships and commercial infrastructure already exist. Avoid the dilution and complexity that come with overdiversification into unfamiliar domains. - Balance internal R&D with external innovation
Maintain sourcing agility through a dual-engine model that combines internal research with targeted M&A, licensing and strategic partnerships. This approach ensures access to innovation across modalities and development stages while managing risk and capital efficiency.
Companies that align their commercial, development and investment strategies with these principles will be best positioned to drive sustainable, high-quality growth in an increasingly competitive environment.
For more information, please contact us.
Author’s note: Almost 50% of forecast revenue growth is attributed to the GLP-1 class. This concentration, however, does not impact the core findings and recommendations in the article.
Note: AI tools were used in the drafting of this article.
L.E.K. Consulting is a registered trademark of L.E.K. Consulting LLC. All other products and brands mentioned in this document are properties of their respective owners. © 2025 L.E.K. Consulting LLC
Endnote
1The number of assets is not risk-adjusted for likelihood of approval