


When US Transportation Secretary Pete Buttigieg was sworn into office on 3 Feb 2021, he wasted no time signalling his key priority in office.
Just two days later he said: “I want the US to be leading the world when it comes to access to high-speed rail, and I think we have a real opportunity to do that, especially with the bipartisan appetite for real investments that we have before us this year.”
Buttigieg’s words are backed by commitment from the very top, with President Biden pledging to spark a “second great railroad revolution” and earmarking over $70 billion in federal aid to “invest in reliable passenger and freight rail” — funds that would, in part, update a rail network that lags behind Europe and Asia in terms of speed and safety, but also serve as a means to reduce greenhouse gas emissions.
In this short article, we describe the types of city pairs in the United States that could be successful high-speed rail (HSR) routes, based on our global knowledge and 25 years of experience in railway ridership analysis.
Private investment will be crucial
Given the current state of the US rail network, it seems likely that turning this ambition into reality will require significant private investment alongside that government funding — particularly if the Biden administration is to make significant progress towards a “national high-speed rail network from coast to coast.”
That is because developments in the United States’ road and air transport infrastructure — which are among the most sophisticated innovations in the world — have not extended to its rail networks, which now lag behind HSR services in Europe and Asia.
Indeed, at present, the US does not have any truly high-speed rail services. The Acela Express connecting Washington DC to Boston is the fastest train service in the US, but despite a maximum operating speed of 150 mph, average speeds over the journey are closer to 70 mph. Meanwhile, across the vast majority of existing US passenger rail networks, average speeds are just 40 mph.
To put that in context, true HSR routes connecting cities in Asia and Europe achieve maximum operating speeds in excess of 250 mph, while average speeds reach 125-150 mph.
If you build it, will they come?
Upgrading the United States’ creaking rail infrastructure to deliver a coast-to-coast, true high-speed rail network is, therefore, far from straightforward — a fact that is compounded by quite significant political opposition that sees investment in high-speed rail as wasteful and characterised by construction delays.
The key to overcoming those barriers and objections, and to maximising the impact of investment dollars, is in taking a commercial approach to HSR planning. It is not enough to simply focus on the big ‘coast to coast’ picture. As with any vision for fundamental change, delivering a viable reality is about tempering that vision with clear commercial thinking.
In turn, that means taking a more granular view, and identifying the right city pairs to connect — and here, a great deal can be learned from successful HSR connections in Europe and Asia.
Find the sweet spots
As a consultancy with the ability to pair strategic thinking with commercial forecasting — and having already consulted on a 240-mile HSR project in Texas, as well as projects in other US states and around the world — L.E.K. Consulting is well positioned to provide that commercial-centric view that will enable investors to identify ‘sweet spots’ for successful HSR services across the US.
In our experience, those sweet spots share a number of key characteristics, as they:
- Connect large cities and have stations located close to population and economic centres
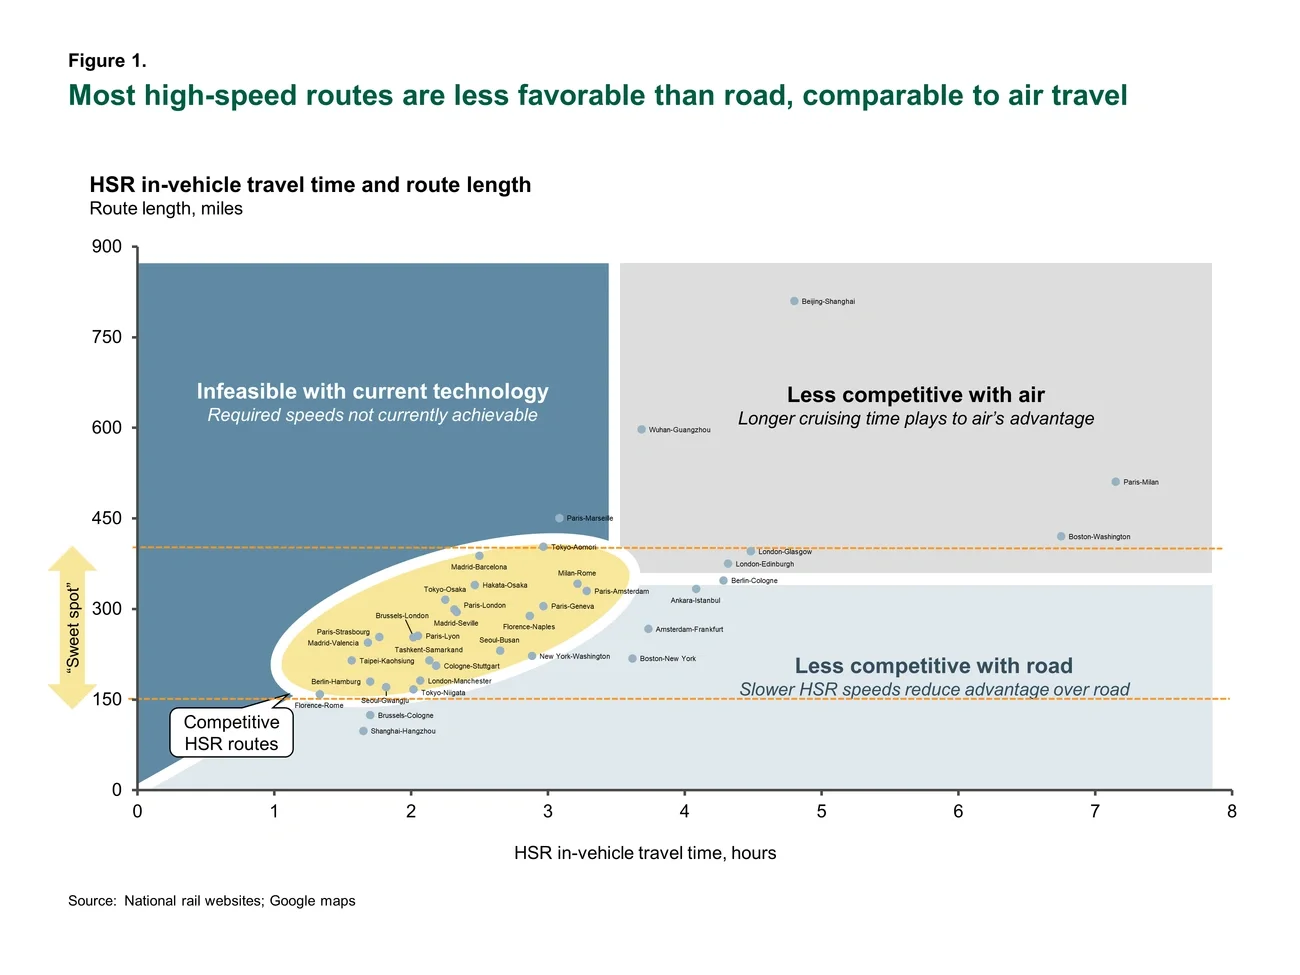
- Are the optimal distance apart to be competitive with road and air networks — far enough for substantial time savings over road travel, but also short enough to compete with air travel
- Deliver fast average speeds, thanks to fewer intermediate stops and clearer routes
- Have the commercial freedom to maximise profit rather than passenger volume
That insight is borne out by route length and travel time analysis of successful HSR city pairs around the world, as demonstrated by the chart below (see Figure 1), where the most competitive pairs lie within the yellow ellipse.