Key takeaways

  • For innovative drugs in China, high prices may result in limited patient adoption; yet national reimbursement requires severe price cuts from launch prices, thereby driving the need to optimize pricing strategy for market access.
     
  • Using the abundance of real-world data (RWD) in China to complement traditional datasets, pharma companies are able to obtain a real-time market view and better model predictions.
     
  • L.E.K.’s analysis of LinkDoc’s RWD demonstrates several ways to drive a more nuanced and impactful pricing strategy: assessing market potential, predicting drug adoption and determining indication trade-offs.
     
  • Pharma companies must consider how to best leverage RWD in their pricing and reimbursement negotiation strategies, while considering other ways to use this data to drive market access.

China has expanded reimbursement coverage for innovative drugs in recent years, with more than 40 new oncology drugs entering the National Reimbursement Drug List (NRDL) since 2017, many through price negotiations, bringing new and highly accelerated market access opportunities for pharma companies with an innovative product pipeline. Most recently China extended the approval date cutoff by over seven months for new drugs to be considered in the 2020 NRDL update, largely to the benefit of oncology drugs such as new programmed cell death protein 1 (PD-1)/programmed death-ligand 1 (PD-L1) drugs.1 

In return for national reimbursement, China’s government expects a significant price cut from launch prices for expensive medicines, while at the same time the out-of-pocket (OOP) cost of nonreimbursed drugs are often prohibitively high for most patients in mainland China, leading to severely restricted adoption before reimbursement. Therefore, pharmaceutical companies need to optimize their pricing strategy for the product launch and reimbursement to drive greater patient adoption while at the same time supporting long-term value maximization via reimbursement negotiations. 

With real-world data (RWD) becoming more widely available in China, pharma companies have a new resource to complement their internal data and other traditional datasets in order to design pricing strategies for product launch and market access.

In this Executive Insights, we propose how pharma companies can use RWD to optimize their pricing strategy in China. The massive market for non-small cell lung cancer (NSCLC) therapeutics is featured as an illustrative example, drawing on analysis of RWD from LinkDoc’s disease database and practical insights from L.E.K. Consulting’s APAC Life Sciences team.2

Optimizing pricing for launch success and reimbursement inclusion

For most pharma companies in China, obtaining reimbursement is a critical value driver for their therapies. Innovative therapies are usually launched with patients paying OOP for treatment costs, where some may receive financial assistance from commercial and patient assistance programs (PAPs). However, the OOP cost of nonreimbursed, innovative drugs can be prohibitively high for most China households, severely limiting adoption. 

For example, for nonreimbursed NSCLC therapies such as pembrolizumab (Keytruda) and durvalumab (Imfinzi), the treatment cost paid OOP is more than six times the average annual household disposable income, despite China treatment costs being lower than those in the U.S. (see Figure 1). Even after subsidies with PAPs, the OOP cost is still about three times the average annual household income (see Figure 1), which only 7% of Chinese households could fund from disposable income.

To drive better market access for patients, pharma companies often need to pursue reimbursement. Therefore, it is key to develop evidence that will support pricing through reimbursement negotiations, and ensure that the severe price cuts needed to enter the NRDL do indeed result in major volume upticks following listing to maximize revenue in the long run. For pharma companies participating in the Q4 2020 NRDL negotiations, RWD will also facilitate quick preparation for upcoming discussions.

Using RWD to optimize pricing strategy

To formulate their pricing strategy, pharma companies should account for several key considerations. Each product’s unique value proposition will influence the pricing and premium it could command in the market. Pharma companies are operating in increasingly competitive indications with an increasing number of therapeutic options available. Needless to say, having a good understanding of competitors' pricing strategies and market switching dynamics both at launch and through the life cycle as other competing products enter the market remain critical.

Pharma companies are under ever greater pressure to optimize returns, for which they need a complete understanding of volumes, revenue and profitability under a range of different price scenarios and strategies. RWD is fast developing as an additional source that can complement pharma’s internal and traditional datasets to assess potential outcomes under different market access strategies. There is an increased volume and variety of RWD in China, as China made healthcare big data a national priority in 2018, encouraging healthcare institutions to share and exchange big data.3 

These policies enabling and encouraging use of RWD will continue to drive increased use and generation of data pools that pharma companies can use to improve a wide variety of business intelligence and planning processes. These include estimating their addressable patient base, adoption, patient volumes before and after reimbursement, and revenue per patient. These better estimations can then flow through into more confident and realistic resource allocations, market access and pricing strategies. 

Assessing market potential

Using RWD, companies can develop a more precise view on the price-adoption relationship to decide on acceptable ranges for launch price and/or reimbursement price, as well as how hard they should be pursuing national reimbursement. Since reimbursement negotiations are now taking place shortly after drug approval (just a matter of weeks for some oncology therapeutics launched during 2020), pharma companies need to use up-to-the-moment RWD from their own products as well as reference drugs (for example, those in the same drug class) in the market. 

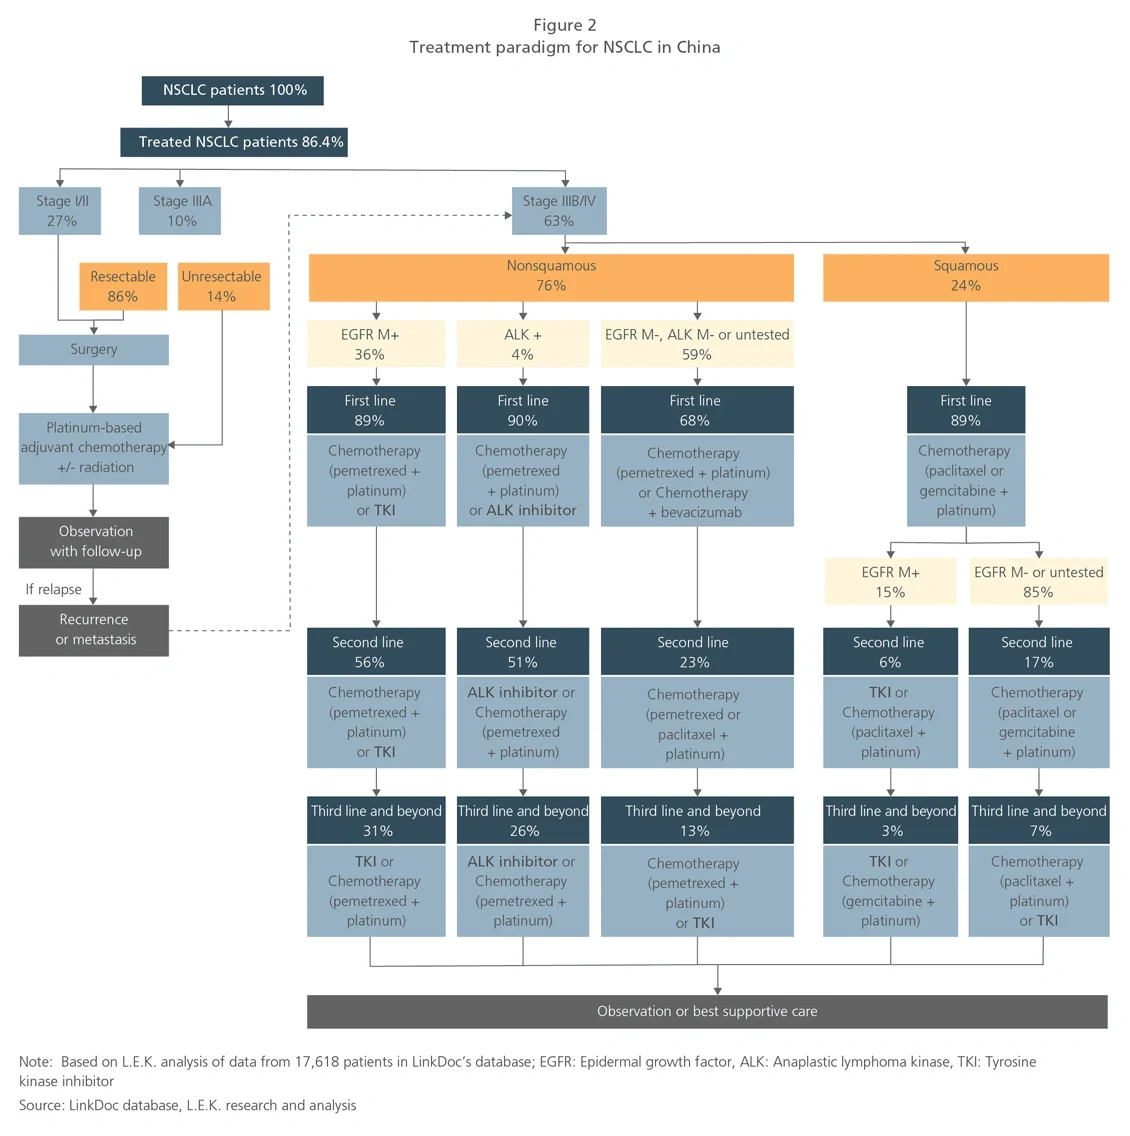
To assess the potential patient volume captured, pharma companies need to determine the addressable patient base. RWD exists in abundance for this analysis, including patient segmentation by disease stage, diagnostic testing rate, treatment rate and line of treatment. This will support precise quantification of the target patient base. For example, based on L.E.K. analysis of a sample in 2019 of over 17,000 NSCLC patients, 48% of all treated patients are nonsquamous, and 31% of epidermal growth factor receptor (EGFR) mutation-positive nonsquamous patients will progress to third-line treatment (see Figure 2).

Predicting adoption

RWD on past prescription behavior can also indicate how a new drug may be adopted once launched, and inform both pricing and other launch-related strategies.

For example, when L.E.K. analyzed data from over 26,000 physicians for two tyrosine kinase inhibitors (TKIs), physician adoption of Drug A grew from 0.7% in the respiratory department in launch year to about 5.6% in Year 3 post-launch, whereas Drug B saw greater adoption of 2.4% in the oncology department in launch year to 10.9% in Year 3 post-launch (see Figure 3). Both therapies entered the NRDL late in Year 2 following launch, which more than doubled adoption in just one year, albeit with variations between departments (see Figure 3). This means the successful NRDL inclusion has resulted in sharp increase in the adoption rates, suggesting that timely local implementation of negotiation results should be expected.

In addition, for both therapies, the oncology department had higher adoption rates in the launch year, but the respiratory department’s adoption rate rose after reimbursement became available (see Figure 3). Based on L.E.K. experience, this is due to China oncology departments following the U.S. National Comprehensive Cancer Network (NCCN) guidelines, which are translated into Mandarin Chinese swiftly after publication.4 Thus, oncology departments are likely to have a higher initial adoption rate for new innovative treatments recommended by NCCN. With the availability of reimbursement, respiratory departments may be more inclined to prescribe due to increased patient affordability, lower likelihood to exceed the hospitals’ cost-control measure of the maximum drug spending ratio, and increased availability of the drugs within the hospitals.

Pharma companies should also tailor different launch strategies and promotional efforts by department, and deliver tailored marketing strategies to the respective departments that consider the return on investment likely at different stages of the launch and reimbursement cycle. In the longer term, more real-world information from drugs that have reached their peak adoption rates will further aid pharma companies in estimating expected peak adoption rates and the corresponding addressable patient volumes.

Though it is clear that reimbursement program type influences patient adoption of cancer therapies, pharma companies are now able to use RWD to bridge the data gaps. For example, based on L.E.K. analysis of drug adoption rates by insurance type for over 64,000 advanced NSCLC patients, there is a higher adoption rate of immunotherapy drugs in patients with the Urban Employee Basic Medical Insurance (UEBMI) at 3.9%, as compared to those with the Urban Rural Residents Basic Medical Insurance (URRBMI) at 2.3% where reimbursement levels and limits are typically lower (see Figure 4). 

Private medical insurance, though covering only a small fraction of patients in China, has allowed greater adoption of immunotherapy drugs at 5.2% (see Figure 4). The more generous reimbursement provided by UEBMI and private medical insurance has clearly better alleviated patient affordability burdens. UEBMI covers employed individuals with an additional fee paid by the employer; URRBMI covers nonemployed individuals, such as students, retirees and rural residents. For example, in the city of Shanghai, UEBMI reimburses 85% of costs for inpatients, whereas URRBMI reimburses 60% for inpatients aged 18-59 and treated in Level 3 hospitals (typically larger hospitals with at least 500 beds). Pharma companies can use RWD to predict adoption rates for their therapies across populations covered by different insurance types.

RWD can also inform revenue per patient and support pharma companies in designing PAPs that fulfill their objectives, as treatment duration from real-world practices varies greatly compared with that from clinical trials. 

For example, when L.E.K. examined data from four immuno-oncology therapies with 90 to 170 patients on each therapy, the actual duration of treatment in the real world may be only half of the median progression-free survival observed in clinical trials (see Figure 5). In real-world experience, patients have a wide range of drivers for dropping off treatment, including affordability issues, willingness to pay, access to drugs or late diagnosis. By analyzing RWD for similar drugs, pharma companies can better predict real-world dynamics for patients on therapy and adjust their pricing strategies and revenue expectations accordingly.

Determining indication trade-offs

Pharma companies also need to take into account the pricing strategy when a product being launched has multiple indications. China allows only one price per unit product, though there are variations in product strength. RWD can be used to optimize for lifetime product value across the complex price-volume dynamics for each indication and collectively over the life cycle of the product.

Pharma companies often pursue a registration strategy to start with clinical trials for one indication with a smaller patient base to improve their likelihood of success in obtaining regulatory approval. Clinical trials and registration for other indications will then follow. Therefore, the price cuts they offer to achieve reimbursement for an approved indication will potentially impact the uptake of other future indications, even before they are reimbursed.

For example, when L.E.K. analyzed LinkDoc’s dataset of patients with Indications A and B receiving immuno-oncology therapies, immunotherapy Drug X’s market share within this patient population was around 25% prior to reimbursement inclusion (see Figure 6). Drug X then achieved national reimbursement with a >60% price cut 11 months after launch, specifically for use in another indication (Indication C). After reimbursement, Drug X’s share in the drug class grew from 25% to 36% over just two months (see Figure 6) in the indications that are not reimbursed (Indications A and B).
 

Drug X gained significant volume due to increased usage by patients for nonreimbursed indications, after a hefty price cut. The price cut improved patient affordability and increased the number of hospitals that carried the drug, driving improved access for patients. RWD can therefore drive a better understanding of potential sales contributions across different indications and allow better tailoring of pricing strategy for value maximization.

Conclusion

Optimizing pricing for a therapy has a great impact on its potential for commercial success in any market, and perhaps none more so than China. An optimal pricing strategy ensures that physicians are willing to prescribe the therapy at product launch and improves chances that payers are willing to reimburse it during later reimbursement negotiations, thus broadening the product’s market access. 

The advent of RWD adds a more real-time, accurate view of what is happening in clinical practice. It also improves the accuracy of pricing models with increased robustness and granularity, as well as reducing the time taken for such analysis, thus elevating the development of pricing strategy to the next level. 

Key questions for pharma companies to consider in using RWD to design their pricing strategy include:

  • Which therapies in our portfolio would be suitable candidates for using enhanced RWD to design a pricing strategy?
  • What therapies with RWD are appropriate as references or comparators for our portfolio therapies? 
  • What types of RWD are available and valuable to support market access? What types of RWD do we need to design our pricing strategy?
  • How can we most reliably and cost-effectively access RWD? What partnerships should we pursue?
  • What is the best way to use RWD in our negotiation strategy for reimbursement?
  • What are the pricing strategies for our competitors, and how are they using RWD?
  • What are the right ways to analyze RWD to ensure the correct interpretation? 

In this Executive Insights, we have outlined the potential strategies to optimize pricing strategy using RWD in China. Beyond commercial strategies, RWD can also be leveraged to design innovative outcome-based payment models and formulate a clinical development strategy to reduce time to market — topics L.E.K. will cover in subsequent reports

Endnotes

1“2020 年国家医保药品目录调整 工作方案” 2020 National Reimbursement Drug List Adjusted Work Plan, National Healthcare Security Administration (NHSA), August 18, 2020 
2Opportunities and Patient Insights into the China Oncology Market, L.E.K. Consulting, January 10, 2020 
3“国家健康医疗大数据标准、安全和服务管理办法(试行)” National Healthcare Big Data Standards, Safety and Service Management Measures, National Health Commission (NHC) of the People’s Republic of China, September 13, 2018
4Maximizing Oncology Success Through World-Class Guideline and Compendia Strategies, L.E.K. Consulting, February 18, 2020

Related Insights