


The COVID-19 pandemic has radically changed the way people behave across the world. While to date the health impacts have been less severe in Australia than in many other countries, behavioural changes have still been very significant, posing new challenges and opportunities for infrastructure. In late 2020, L.E.K. Consulting was engaged by Infrastructure Australia (the Australian government’s independent infrastructure agency) to investigate the impacts of the pandemic on different categories of infrastructure (see Figure 1).
Executive Insights
COVID-19 Impacts on Infrastructure Use in Australia
COVID-19 Impacts on Infrastructure Use in Australia
April 7, 2021
Key Takeaways
The COVID-10 pandemic has changed behavior around the world; despite the low case rate in Australia, infrastructure was still significantly affected.
L.E.K. Consulting was engaged by Infrastructure Australia to investigate the pandemic’s impact on different categories of infrastructure.
Areas affected include housing, social infrastructure, telecommunications, energy and waste.
There has been a rapid shift from physical to digital interaction, a redistribution of demand for utilities, and an increase in service innovations.
Figure 1
As the first wave of infections grew in Australia, protective health and travel measures were introduced by Australian and state governments in March 2020
Image
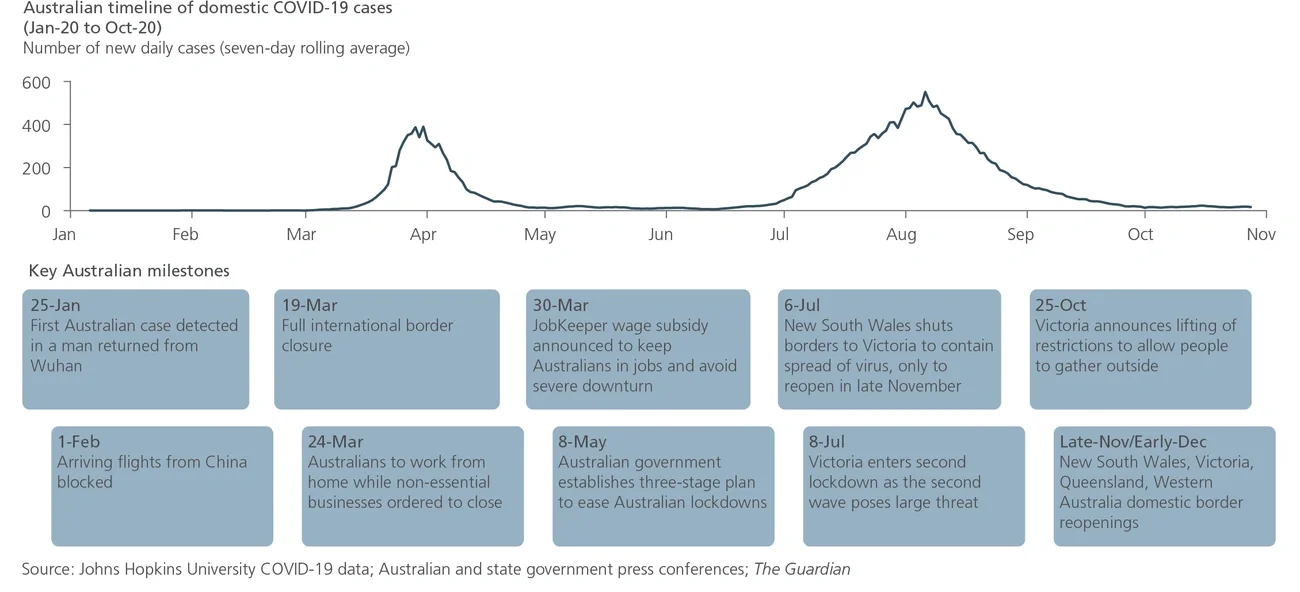
To protect their citizens, Australian governments (commonwealth and state) implemented a variety of restrictions such as border controls, lockdowns, compulsory wearing of face masks and social distancing. In Australia these measures have, to date, relatively successfully contained national case numbers but have also radically changed behaviour. People are working, living, consuming and relaxing differently. These behavioural changes have impacted the way they use infrastructure.
When asked, most Australians say they plan to return to pre-COVID-19 behaviours in many areas. While it is not clear exactly which trends will continue, the characteristics of the behavioural changes provide insight as to what is likely to continue beyond the pandemic and the country’s recovery.
Four million people (approximately 30% of the total Australian workforce) worked from home from March 2020 to slow the virus’s spread. This change in working patterns has been significant, shifting the distribution of demand for telecommunications, energy and transport infrastructure from central business district (CBD) areas to the suburbs. Working from home forced flexibility, with businesses having to adapt to effectively work remotely. As companies prepare post-COVID-19 working strategies, the capability created during COVID-19 to work more flexibly will almost certainly form a part of these strategies.
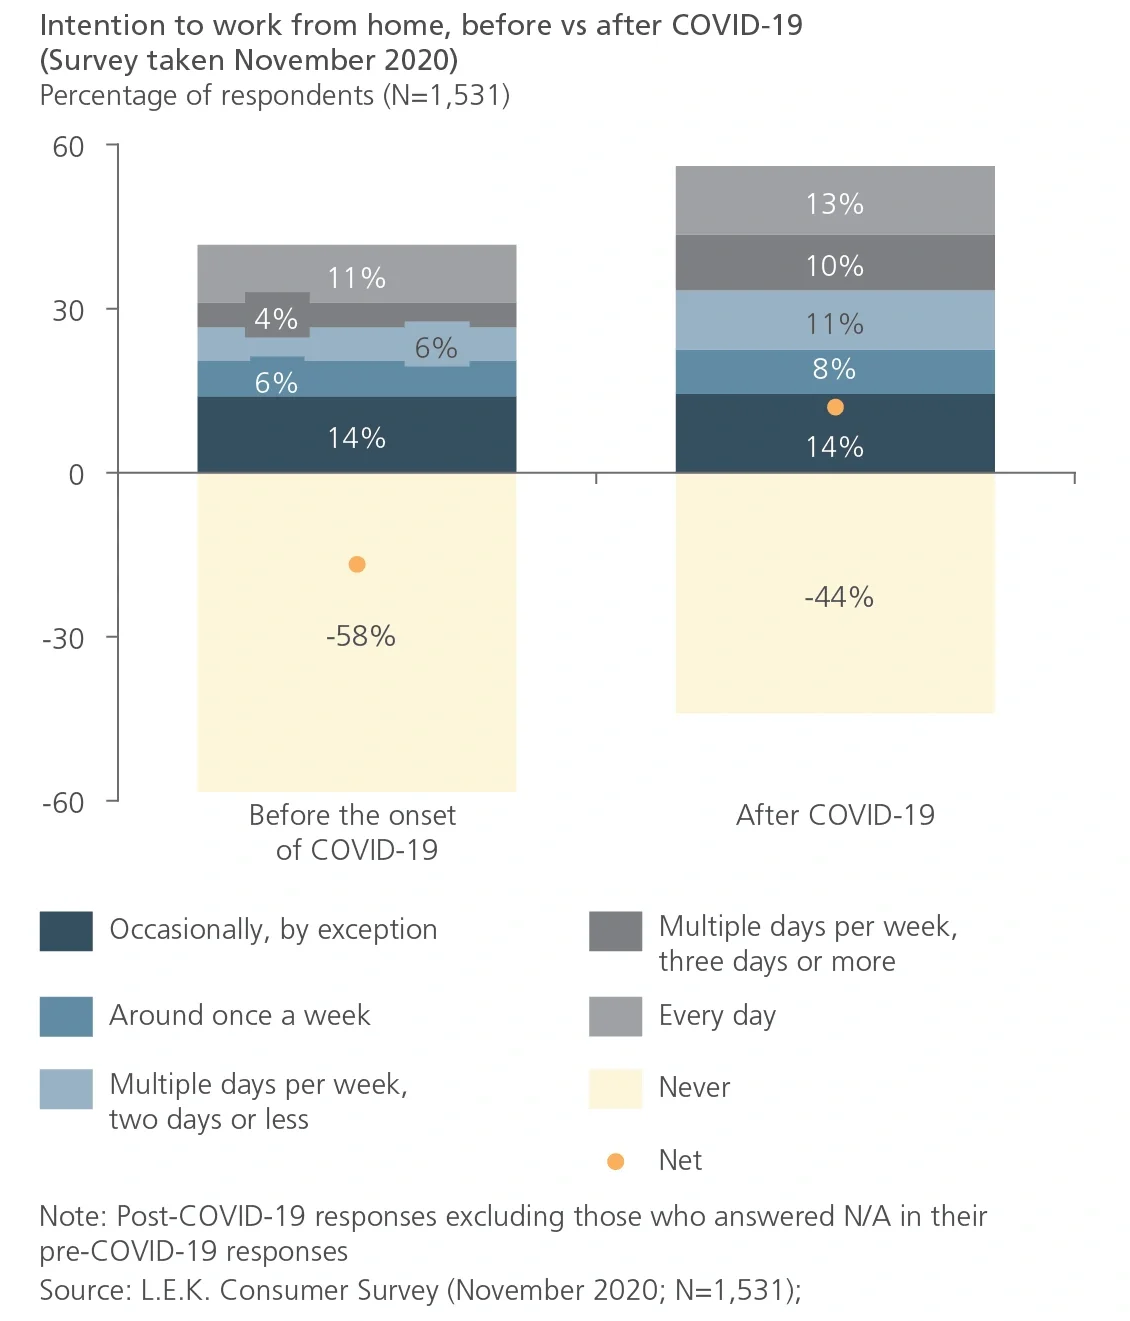
In an L.E.K. survey of consumers, the proportion of people saying they will work from home one or more days per week is now 42%, up from 27% prior to COVID-19. One of the main reasons for the increase is lifestyle flexibility, and this will continue post-pandemic (see Figure 2).
Figure 2
Almost a third of Australia's workforce worked from home during the pandemic, with a third of these hoping to continue post-COVID-19
Image
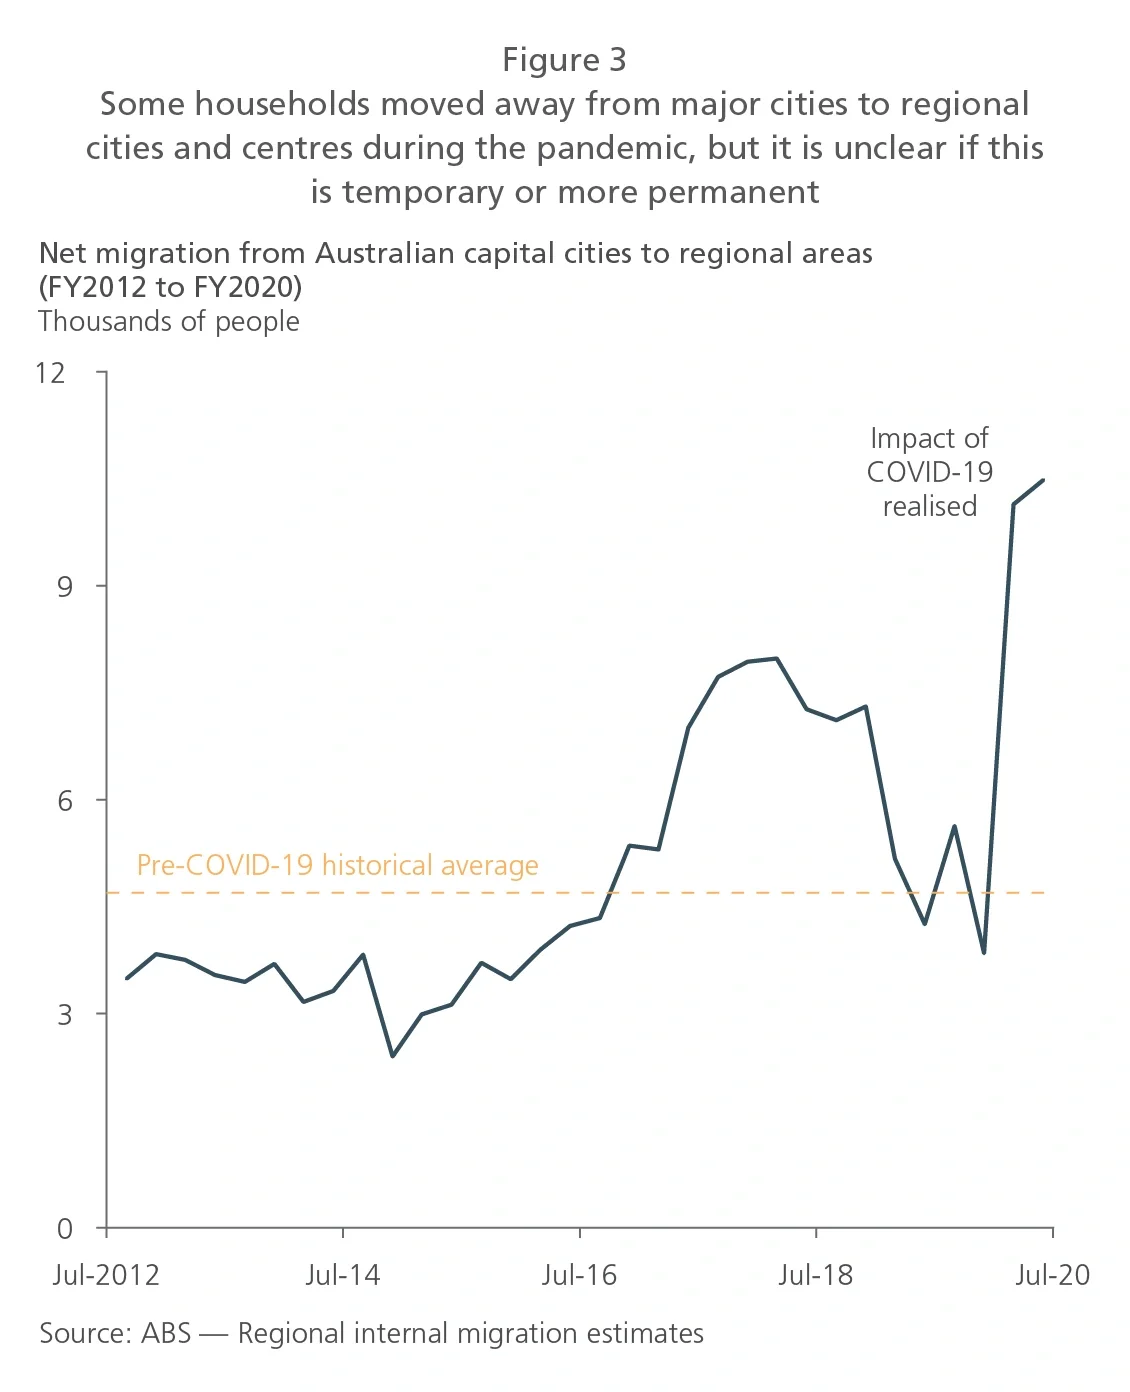
For many, greater working from home has increased the flexibility of where it is possible to live. There has been an increase in capital city residential vacancies and an increase in demand for housing in coastal regional areas, placing increased pressure on local infrastructure. There was a 200% increase in net migration from capital cities to regional areas in the second half of 2020.
It is likely that this change will continue, with the increase in flexible working that now exists supporting more diverse living arrangements (see Figure 3).
Figure 3
Some households moved away from major cities to regional cities and centers during the pandemic, but it is unclear if this is temporary or more permanent
Image
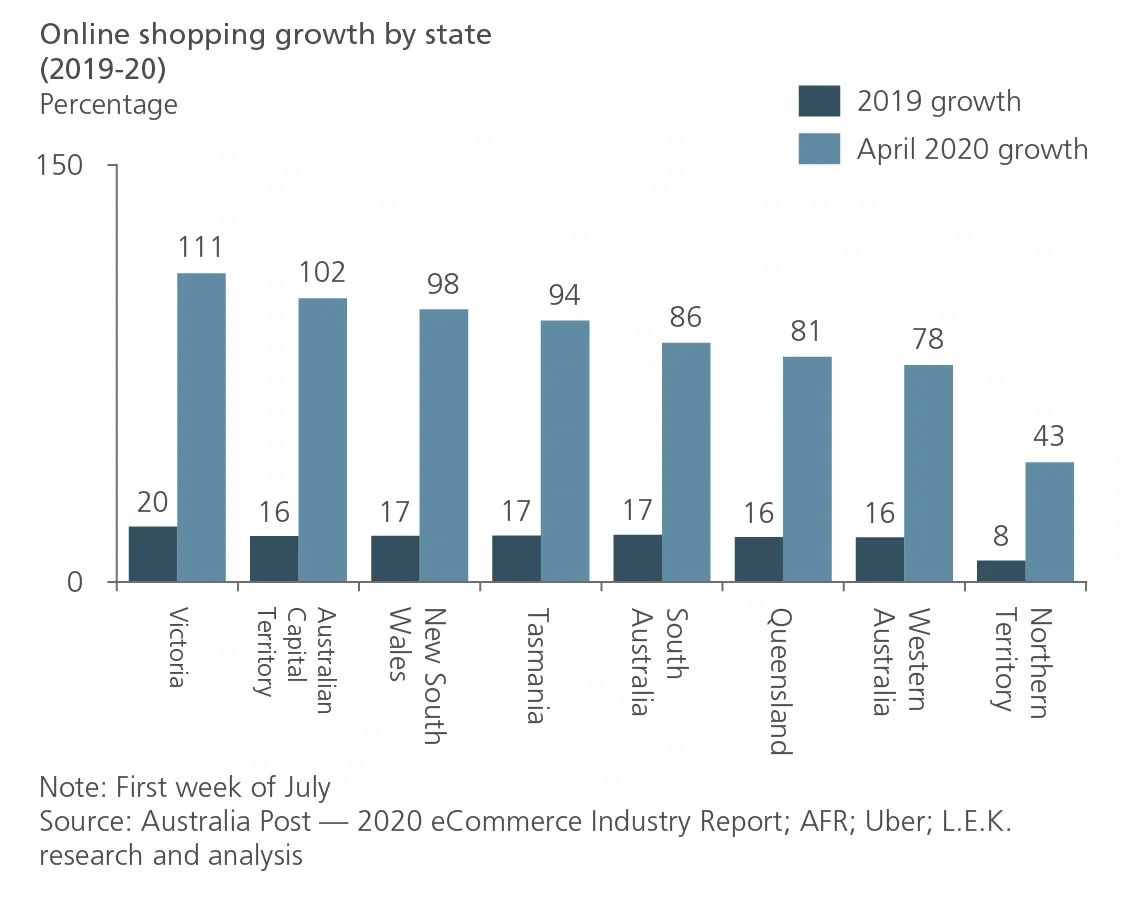
Social distancing, lockdowns and the resulting increase in time spent at home mean that more people are shopping online and using new digitalised financial services. The resulting uplift in home deliveries has generated more demand for last-mile freight delivery. For example, Australia Post recorded its third-biggest day ever on 17 August 2020, at 2.3 million deliveries during Melbourne’s strict lockdown. Consumers surveyed suggested they are unlikely to fully return to their previous use of shopping precincts, with online shopping likely to be more prominent than before COVID-19 (see Figure 4).
Figure 4
In the first full month of lockdown, online shopping grew up to six times the level of annual growth in 2019, increasing the last-mile freight task
Image
Green spaces and corridors have played an essential role during the pandemic as people have used green spaces for exercise and recreation or as part of COVID-19-safe active transport, such as walking or riding.
The number of visits to green spaces is much higher across Australia (excluding Victoria, which was impacted by lockdown). A survey conducted by the NSW Department of Planning, Industry and Environment showed 46% of people spending more time in parks and gardens, with 94% using the spaces for personal exercise. Visitation to major parks such as the Western Sydney Parklands and Centennial Park was up by 144% and 100% respectively year on year.
Public transport demand in most Australian cities fell to 10%-30% of normal levels in the initial lockdown during Q2 2020 but settled at a ‘new normal’ of ~60%-70% in the second half of 2020. The observed trend was similar in Sydney, Brisbane and Perth, despite quite different local COVID-19 case numbers. It suggests that working from home and the fear of infection have been stronger public transport usage drivers than actual COVID-19 case levels (see Figure 5).
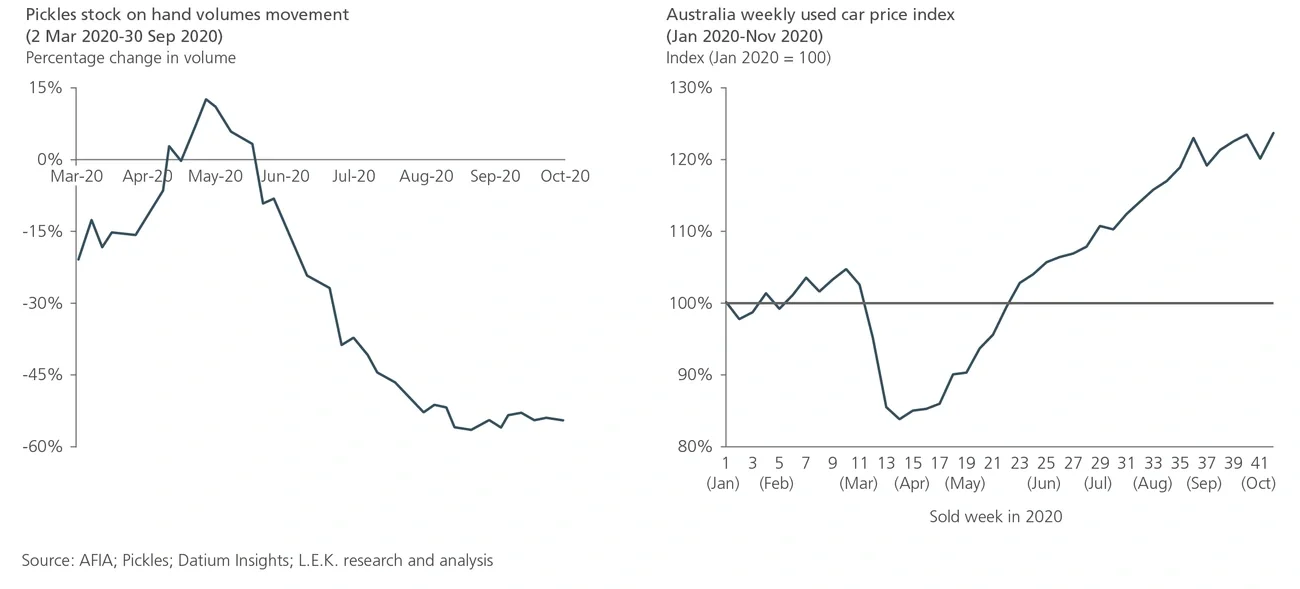
While there was an initial fall in road traffic, current private vehicle use is already higher than pre-COVID-19 levels, reflecting a material increase in mode share. Car purchases act as a leading indicator for future private vehicle use, given the high initial cost of purchase and the low incremental cost of each trip. During 2020, demand for second-hand vehicles surged, suggesting that the increase in private vehicle use is likely to continue, raising potential challenges for traffic congestion if the modal shift is not reversed (see Figure 6).
Figure 5
Low recovery of public transport use is a national trend, and evident even in cities with lower COVID-19 case numbers
Image
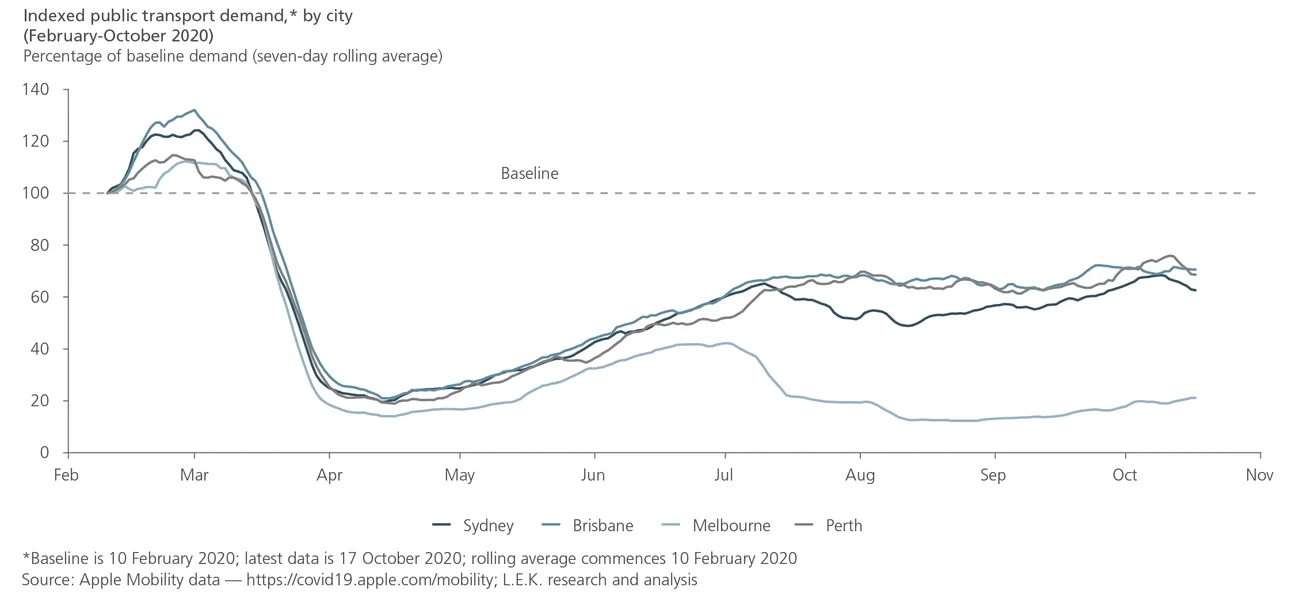
Figure 6
The shortage of used vehicle stock nationally led to an increase in used car prices
Image
The health system rapidly repurposed intensive care unit (ICU) capacity and equipment to manage COVID-19 cases. ICUs increased their capacity from around 4,600 beds to almost 12,000 beds across Australia. However, the repurposing of hospital infrastructure resulted in less preventive healthcare, with the rate of preventive cancer screenings dropping to as low as 19% of 2019 levels, and the number of mammograms dropping from 70,000 to 1,000 across Australia between March and April 2020.
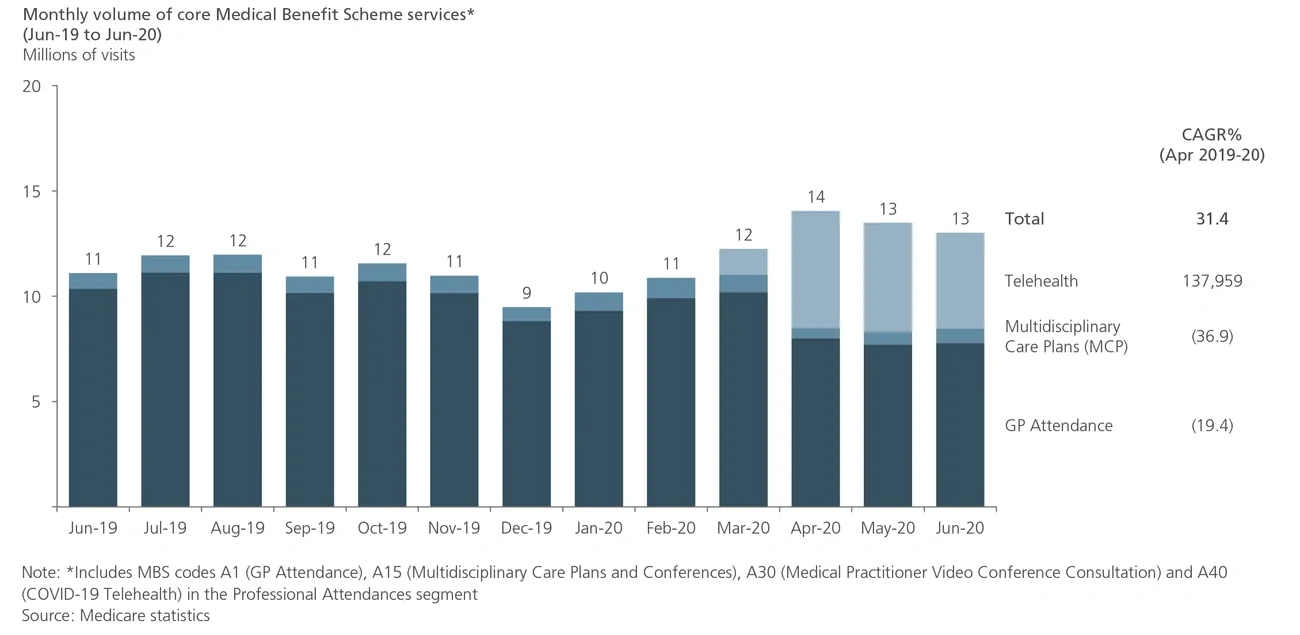
Medical services provided by telehealth grew significantly from 0.04% of all Medicare Benefits Schedule services up to a peak of almost 40% in April, with the Australian government funding 17.2 million telehealth consultations between March and June 2020. Most people intend to continue to use telehealth services for services such as routine check-ups, mild illnesses and prescription filling. Telehealth is likely to be utilised at a higher rate than pre-COVID-19, but the rate of use is linked to the continuation of government funding.
Working from home and the increasing need for physical distance are driving a rapid adoption of digital collaboration tools and accelerating the use of the cloud by businesses. New ways of working are being used by businesses, and personal connections are relying more on video calls than on face-to-face interactions (see Figure 7).
Figure 7
Telehealth service usage increased significantly, enabled by the MBS extension
Image
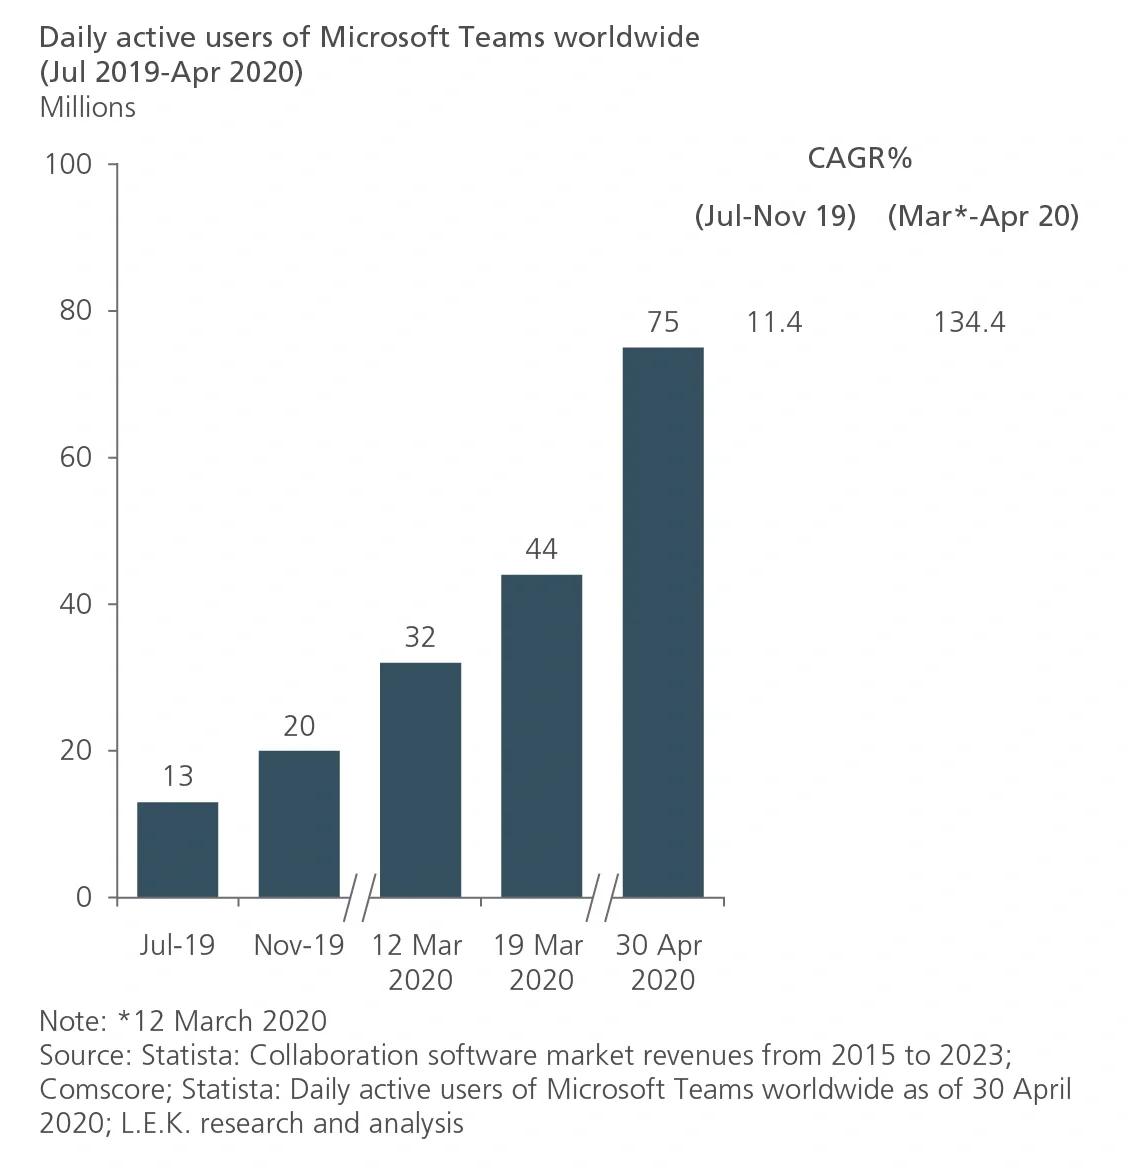
Microsoft Teams is experiencing a surge in usage as the new ways of working are established globally, with the number of daily active users increasing from 32 million in March 2020 to 75 million in April 2020. Zoom’s videoconference adoption rate has been 85% higher during the COVID-19 period. Over a third of people in the survey indicate they are likely to continue to use online collaboration tools at least weekly post-COVID-19 (see Figure 8).
Figure 8
The COVID-19 lockdowns significantly accelerated the uptake of online collaboration tools by businesses
Image
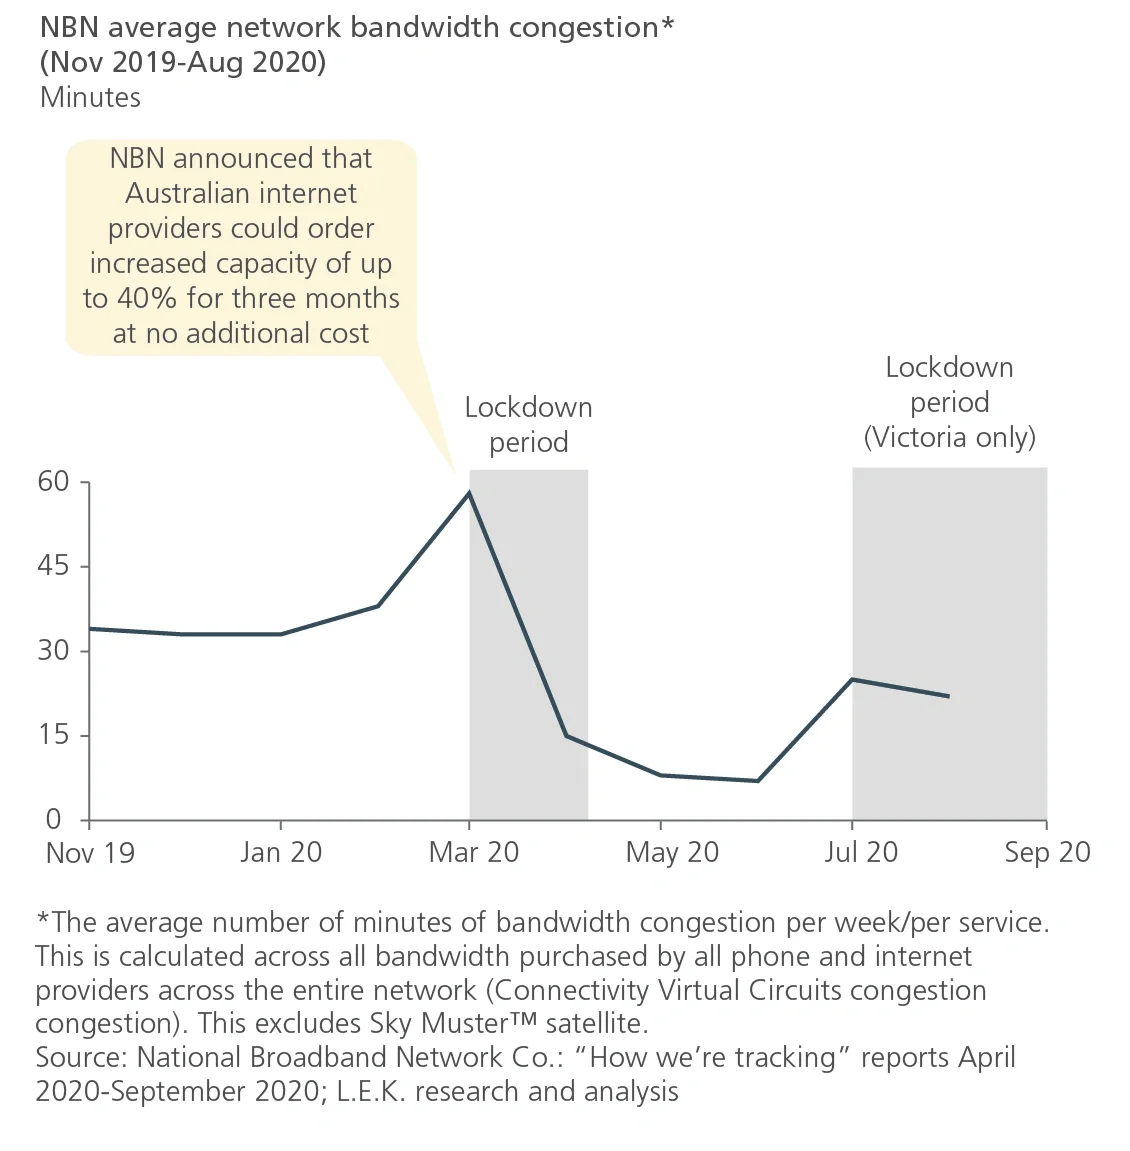
While congestion rose on the National Broadband Network (NBN) in the early part of the pandemic, an increase of 40% in bandwidth helped service providers largely mitigate the increased network congestion.
Network managers actively reduced bandwidth usage to provide more contingency, for example, through modifying the approach to streaming services to make them less bandwidth intensive (see Figure 9).
Figure 9
The COVID-19 lockdown saw acute bandwidth congestion, which was addressed by NBN increase in capacity for internet service providers
Image
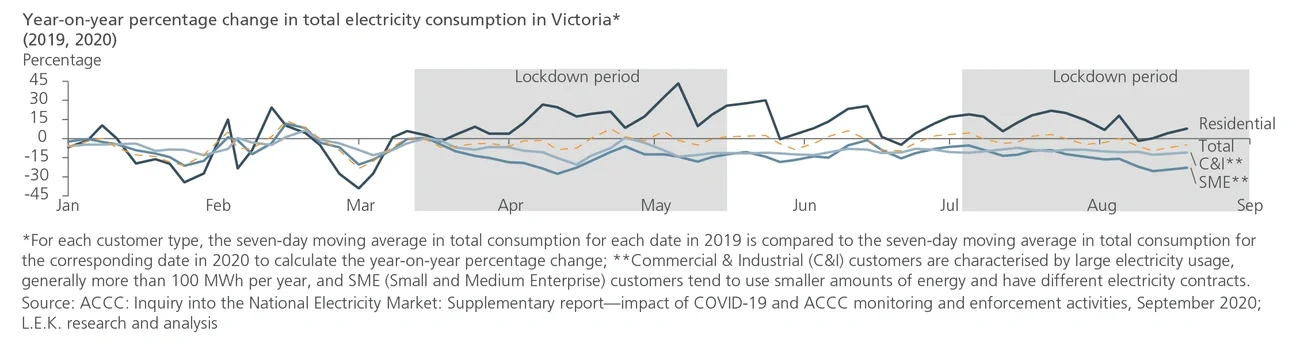
COVID-19 has created a shift in energy demand, with people spending significantly more time at home and less time in offices, resulting in higher residential energy use and lower commercial energy use (see Figure 10).
Figure 10
Higher residential consumption has mostly been offset by lower business consumption, resulting in a marginal overall decrease in demand for 2020
Image
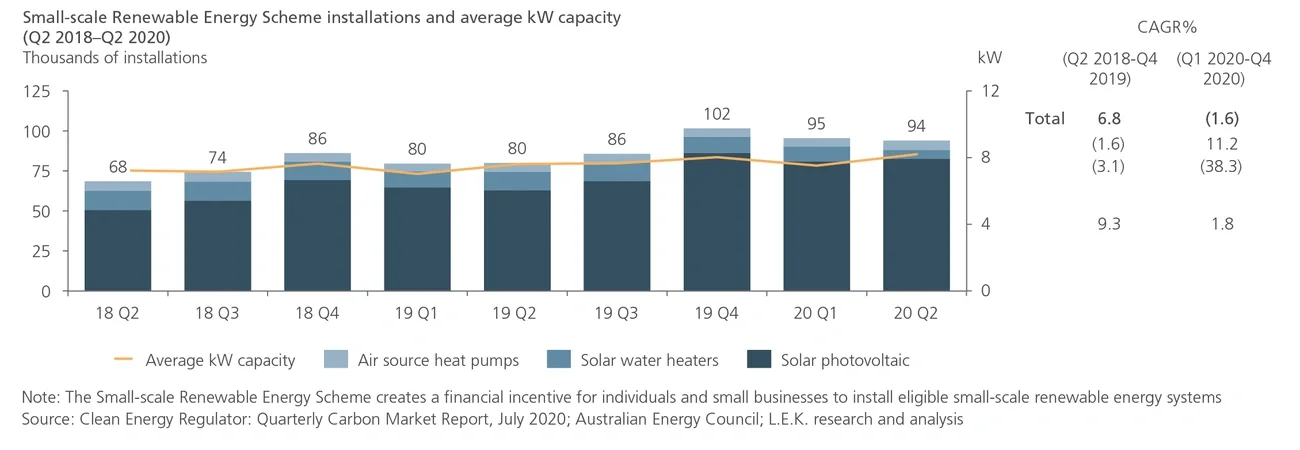
The increase in residential power use corresponded with an increase in the use of distributed and on-site power generation. Small-scale solar installations are increasing, supporting a 7% midday reduction in the average National Electricity Market operational demand. COVID-19 also accelerated the increase in small-scale solar installations, which grew significantly between 2019 and 2020 (see Figure 11).
Figure 11
Installed capacity of rooftop solar panels remains strong
Image
The behavioural changes during COVID-19 have created an increase in per capita municipal waste, reversing the trend of the past 15 years. In 2020, per capita waste generation was 20% higher and forecast to increase further in 2021 (see Figure 12).
Figure 12
In victoria, per capita household waste grew by 5.5% from 2019 to 2020, while Australian household waste reportedly increased by 20% due to COVID-19
Image
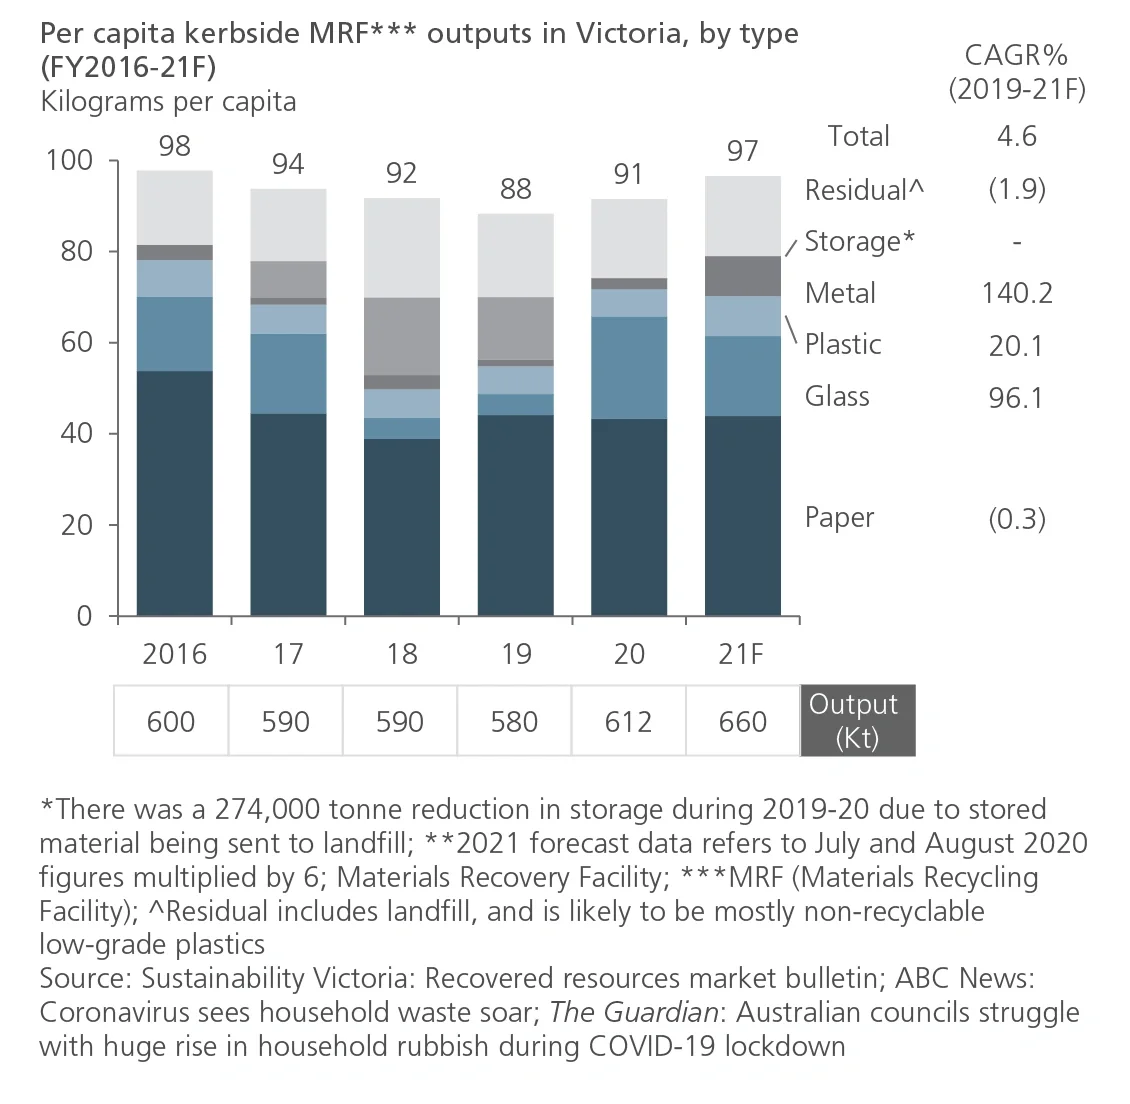
The Australian waste sector is still adapting to the ban on exporting low-grade recyclable material to countries including China. The existing onshore processing capability is limited, and it is difficult to process low-grade recyclable materials economically. Household waste generates these low-grade recyclable materials, with quality issues in part created by the incorrect separation of materials at the household. The trend reversal creating an increase in per capita household waste generation is placing additional pressure on waste processing infrastructure.
COVID-19 has also generated significant demand for single-use personal protective equipment and other medical supplies, significantly increasing the production of medical waste. Medical waste services revenue was up 15% from 2019-20, well ahead of the pre-COVID-19 growth rate of 5.4% (see Figure 13).
Figure 13
There has been a large spike in clinical waste generation due to the increased use of medical equipment, which poses significant health risks if not managed
Image
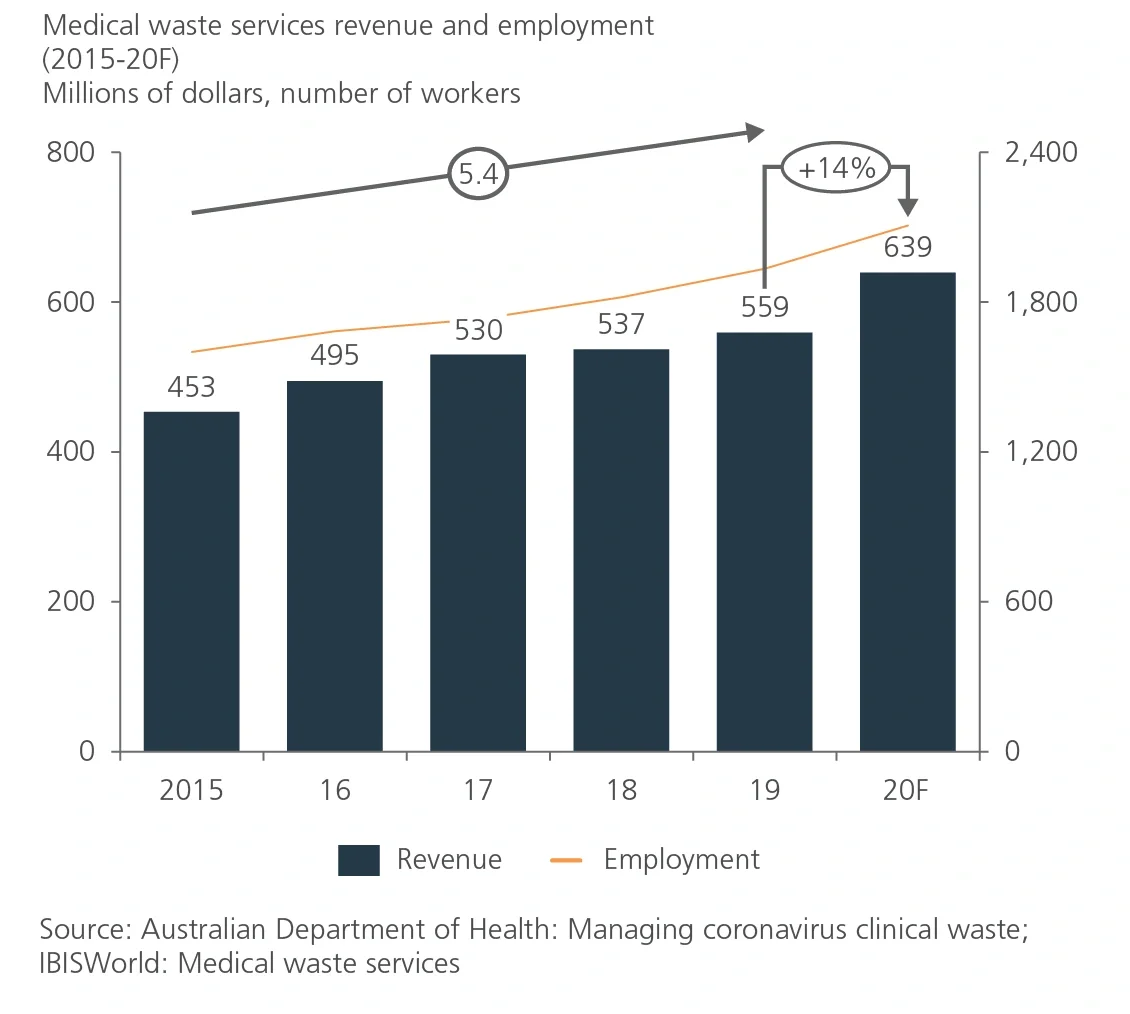
Health departments directly treating COVID-19 and high-risk sectors such as aged care, where infection control is critically important, are driving the increase in medical waste generation. The extreme example is in Victoria, which saw a 100-fold increase in clinical waste generation across the aged care sector during certain periods of 2020.
Several themes are apparent in the ongoing impact of COVID-19 on infrastructure sectors. These themes cut across sectors, are interrelated and are sometimes mutually reinforcing.
Digitalisation: There has been a rapid shift from physical to virtual interaction, increasing convenience for users and providers.
-
In 2020, monthly online retail growth was five to six times the annual growth seen in 2019
-
Nine out of ten Australian firms are adopting new technology, including collaboration tools and cybersecurity
Decentralisation: There has been a redistribution of demand for utilities and an increase in the vibrancy of regional centres.
-
People are moving out of the capital cities and dense metro areas to regional areas at a rate 200% higher than pre-COVID-19
-
Uptake of solar photovoltaic panels increased, with almost 165,000 systems sold under the small-scale renewable energy scheme in the first half of 2020
Localism: More people are making local trips, and travel is increasing in regional and local areas of each state, creating greater regional vibrancy but placing pressure on infrastructure.
- People are increasing their use of national parks and green spaces, up by close to 25% nationally
- Delivery driver demand is shifting, with significant growth in suburban last-mile trips and loading zone use falling to less than half in the Sydney CBD
Service innovation: Providers of services, including governments and businesses, are innovating to support the changing demand requirements.
-
State transport agencies have implemented public transport improvements such as increased cleaning, social distancing initiatives and real-time occupancy data
-
The government has funded telehealth, facilitating 17.2 million telehealth consultations (March-June 2020), peaking at c. 40% of funded services in April, up from less than 1% before COVID-19
Adaptability: There has been a rapid repurposing of infrastructure and assets, and a quick scaling up of latent capacity.
-
The NBN released an additional 40% of latent broadband capacity to service providers to address network congestion
-
Health providers repurposed infrastructure to provide 4,600 new ICU beds, increasing capacity by 290%
The analysis also highlights mutually reinforcing trends, suggesting some stickiness in behaviour. Increasing digitalisation enables decentralisation by making it easier for people to live and work remotely. However, increasing decentralisation will in turn drive greater demand for digitalisation of products to meet the needs of regional residents.
Despite Australia’s very low case rate, almost every category of infrastructure has been impacted by COVID-19, either in terms of overall demand, geographic demand patterns or changing subsector trends. In some cases, trends that were apparent before COVID-19 (e.g. contactless payment) have been accelerated by the pandemic and are unlikely to be reversed. In other cases (e.g. regionalisation), COVID-19 has prompted a U-turn in the underlying trend, and it remains to be seen to what extent behaviour and preferences will return.
Related insights
You might also be interested in these insights.


English